
What is a NASDAQ Index in an Annuity
As an Independent Annuity Broker, we compare rates across 100+ carriers and 1,000 different annuities— not just one company’s product offerings — to find the best fit for your goals.
What is a NASDAQ Index in an Annuity

Jason Stolz CLTC, CRPC, DIA, CAA
A NASDAQ index in an annuity is a benchmark — a reference point used inside the annuity’s crediting formula to calculate how much interest your account earns for a given term. It is not an investment in NASDAQ stocks. It is not a fund purchase. You do not hold shares of any companies in the index, and your principal does not move up and down with the market the way a brokerage account does. When a fixed indexed annuity references a NASDAQ benchmark, the insurance carrier uses the index’s measured movement over a defined period to determine credited interest, then applies the contract’s governing limits — a cap, a participation rate, or a spread — to produce the actual credited amount. That credited interest is then locked in and added to your account value for that term. If the index measures negatively over the term, most NASDAQ index strategies in an annuity credit zero rather than reducing the account balance.
The NASDAQ benchmark name is familiar and carries associations with innovation, technology, and growth — which is partly why carriers offer it as an index option and why clients find it appealing. But the name is the headline, not the strategy. Understanding how a NASDAQ index in an annuity actually works requires looking at four things: the crediting method that determines how the index movement is measured, the growth control (cap, participation rate, or spread) that determines how much of that movement translates into credited interest, the term length over which the measurement occurs, and how renewals work when that term ends. At Diversified Insurance Brokers, Jason Stolz, CLTC, CRPC, DIA, CAA helps clients move past the index name and into the mechanics — because that is where the real comparison between products happens. Our resource on how annuities earn interest covers the foundational crediting framework, and our resource on how a fixed indexed annuity works covers the complete product structure within which NASDAQ index options operate.
Ensure you are receiving the absolute top rates
Current Fixed Annuity Rates
Compare today’s best fixed annuity rates from top carriers.
Current Bonus Annuity Rates
See which annuities offer the highest upfront bonus today.
Request an Annuity Quote
Submit our annuity request form to get personalized rate options.
Lifetime Income Calculator
Use our calculator to see how much guaranteed income your annuity can provide.
NASDAQ Index Crediting Methods — How Each Approach Behaves
The crediting method determines how the NASDAQ index in an annuity is measured — which end-of-term index values are used, over what time intervals, and how the measured result feeds into the credited interest calculation. The same NASDAQ benchmark can produce meaningfully different credited interest outcomes under different methods in the same market environment. Understanding these differences is the single most useful analytical tool for comparing two products that both reference the same index.
Sample rates for illustrative comparison. Actual premiums depend on carrier, plan level, state, and underwriting details.
| Crediting Method | How the Index Is Measured | Performs Best In | Most Exposed To | Typical Growth Control | Best Fit |
|---|---|---|---|---|---|
| Annual Point-to-Point | Compares index level at the start of the term to the index level at the end of the 1-year term; one measurement date determines the entire result | Strong, consistent upward-trending markets where the end-of-term level is meaningfully higher than the start | End-of-term timing risk — a market that rallied all year but pulled back sharply near the term end may credit poorly despite strong mid-year performance | Annual cap or participation rate applied to the measured point-to-point gain | Clients who want maximum simplicity and are comfortable with end-of-term measurement exposure |
| Monthly Averaging | Records the index level at the end of each month throughout the term; the average of those 12 monthly readings is compared to the starting level to determine the gain | Choppy or volatile markets where individual month-end readings average favorably; reduces the impact of a single bad end date | Strongly trending markets where a straight point-to-point comparison at year-end would have credited more than the averaging process produces | Annual cap applied to the averaged result; may allow higher cap than annual P2P since averaging typically reduces measured gain | Clients who want to reduce endpoint timing sensitivity and smooth out measurement across the full term |
| Monthly Sum (with monthly cap) | Measures the index change each month; monthly gains are capped individually (often 1–3%), monthly losses may be limited or uncapped; all 12 monthly results are summed for the annual credit | Steadily positive markets where gains accumulate month by month without large drawdowns; can outperform in consistent upward environments | Volatile markets with sharp month-to-month swings — monthly losses can offset gains and the monthly cap limits individual gain months, potentially producing 0% or low credit despite overall index gain | Monthly cap per period (typically 1–3%); no annual cap; the sum of capped monthly credits determines the annual credited amount | Clients who understand the monthly mechanics and want exposure to steady monthly accumulation patterns |
| 2-Year / Multi-Year Point-to-Point | Extends the measurement window to 2 years (or longer); compares the index level at the start of the extended term to the level at the end; interest is credited at the end of the full term | Markets that recover from early-term drawdowns and finish higher over the longer measurement window; the extended window gives time for recovery | Sustained downturns where even a 2-year window does not produce a positive net result; interest is credited only at term end, so liquidity access is deferred | Higher participation rates often available due to the longer measurement window; some designs use caps, others use uncapped participation | Clients with longer time horizons who want the potential benefit of higher participation or participation structures not available in 1-year terms |
The table makes the single most important NASDAQ annuity index insight concrete: two products that both say “NASDAQ” can behave completely differently in the same market environment if they use different crediting methods. A monthly sum strategy and an annual point-to-point strategy linked to the same NASDAQ benchmark will credit differently in a choppy, volatile year — precisely the kind of market environment where the NASDAQ benchmark’s inherent volatility is most pronounced. Our resource on index annuity crediting methods covers the full crediting method framework in detail, and our resource on what is an annuity cap rate covers how the growth controls applied to these methods determine the maximum credited interest for each term.
What “NASDAQ” Actually Means in a Fixed Indexed Annuity
In most fixed indexed annuities, the NASDAQ reference is to a price index — typically tracking a basket of companies heavily weighted toward technology, communication, and innovation-driven sectors. The most commonly referenced concept is the NASDAQ-100, which includes the 100 largest non-financial domestic and international companies listed on the NASDAQ stock market. Some annuity carriers use the NASDAQ-100 directly. Others use licensed or proprietary indexes that are constructed around NASDAQ methodology or NASDAQ-linked components. The name on the product illustration may say “NASDAQ” while the underlying index construction varies by carrier and product.
This distinction matters because the index construction affects how the benchmark behaves in different market environments — and therefore how the crediting method interacts with the index to produce credited interest in different periods. A heavily technology-weighted index will exhibit different volatility patterns than a broad market index, which affects how caps and participation rates are priced by the carrier’s options hedging strategy. Our resource on how annuities earn interest explains how carriers use options to deliver the indexed crediting structure — relevant context for understanding why caps and participation rates are set where they are for NASDAQ-linked strategies specifically.
The absence of dividends in most NASDAQ index annuity crediting is one of the most commonly misunderstood aspects of the product. Most NASDAQ annuity index strategies credit interest based on the price change of the index — not the total return including dividends. NASDAQ-100 component companies collectively pay dividends, and those dividends contribute meaningfully to total return in a direct investment. In an annuity, the carrier captures the dividend equivalent yield as part of the options pricing structure that supports the crediting mechanism and the downside protection guarantee. This is not a hidden fee; it is the economic mechanism that allows the carrier to offer a 0% floor alongside index-linked upside. Our resource on annuities 101 covers the full product structure for clients who are evaluating indexed annuities for the first time and want to understand the tradeoffs before drilling into specific index options.
Caps, Participation Rates, and Spreads — The Levers That Define Real Outcomes
The NASDAQ index in an annuity tells you what benchmark is being measured. The growth control — cap, participation rate, or spread — tells you how much of that measured movement translates into credited interest. These are the levers that determine real outcomes, and they deserve as much attention as the index name during product comparison.
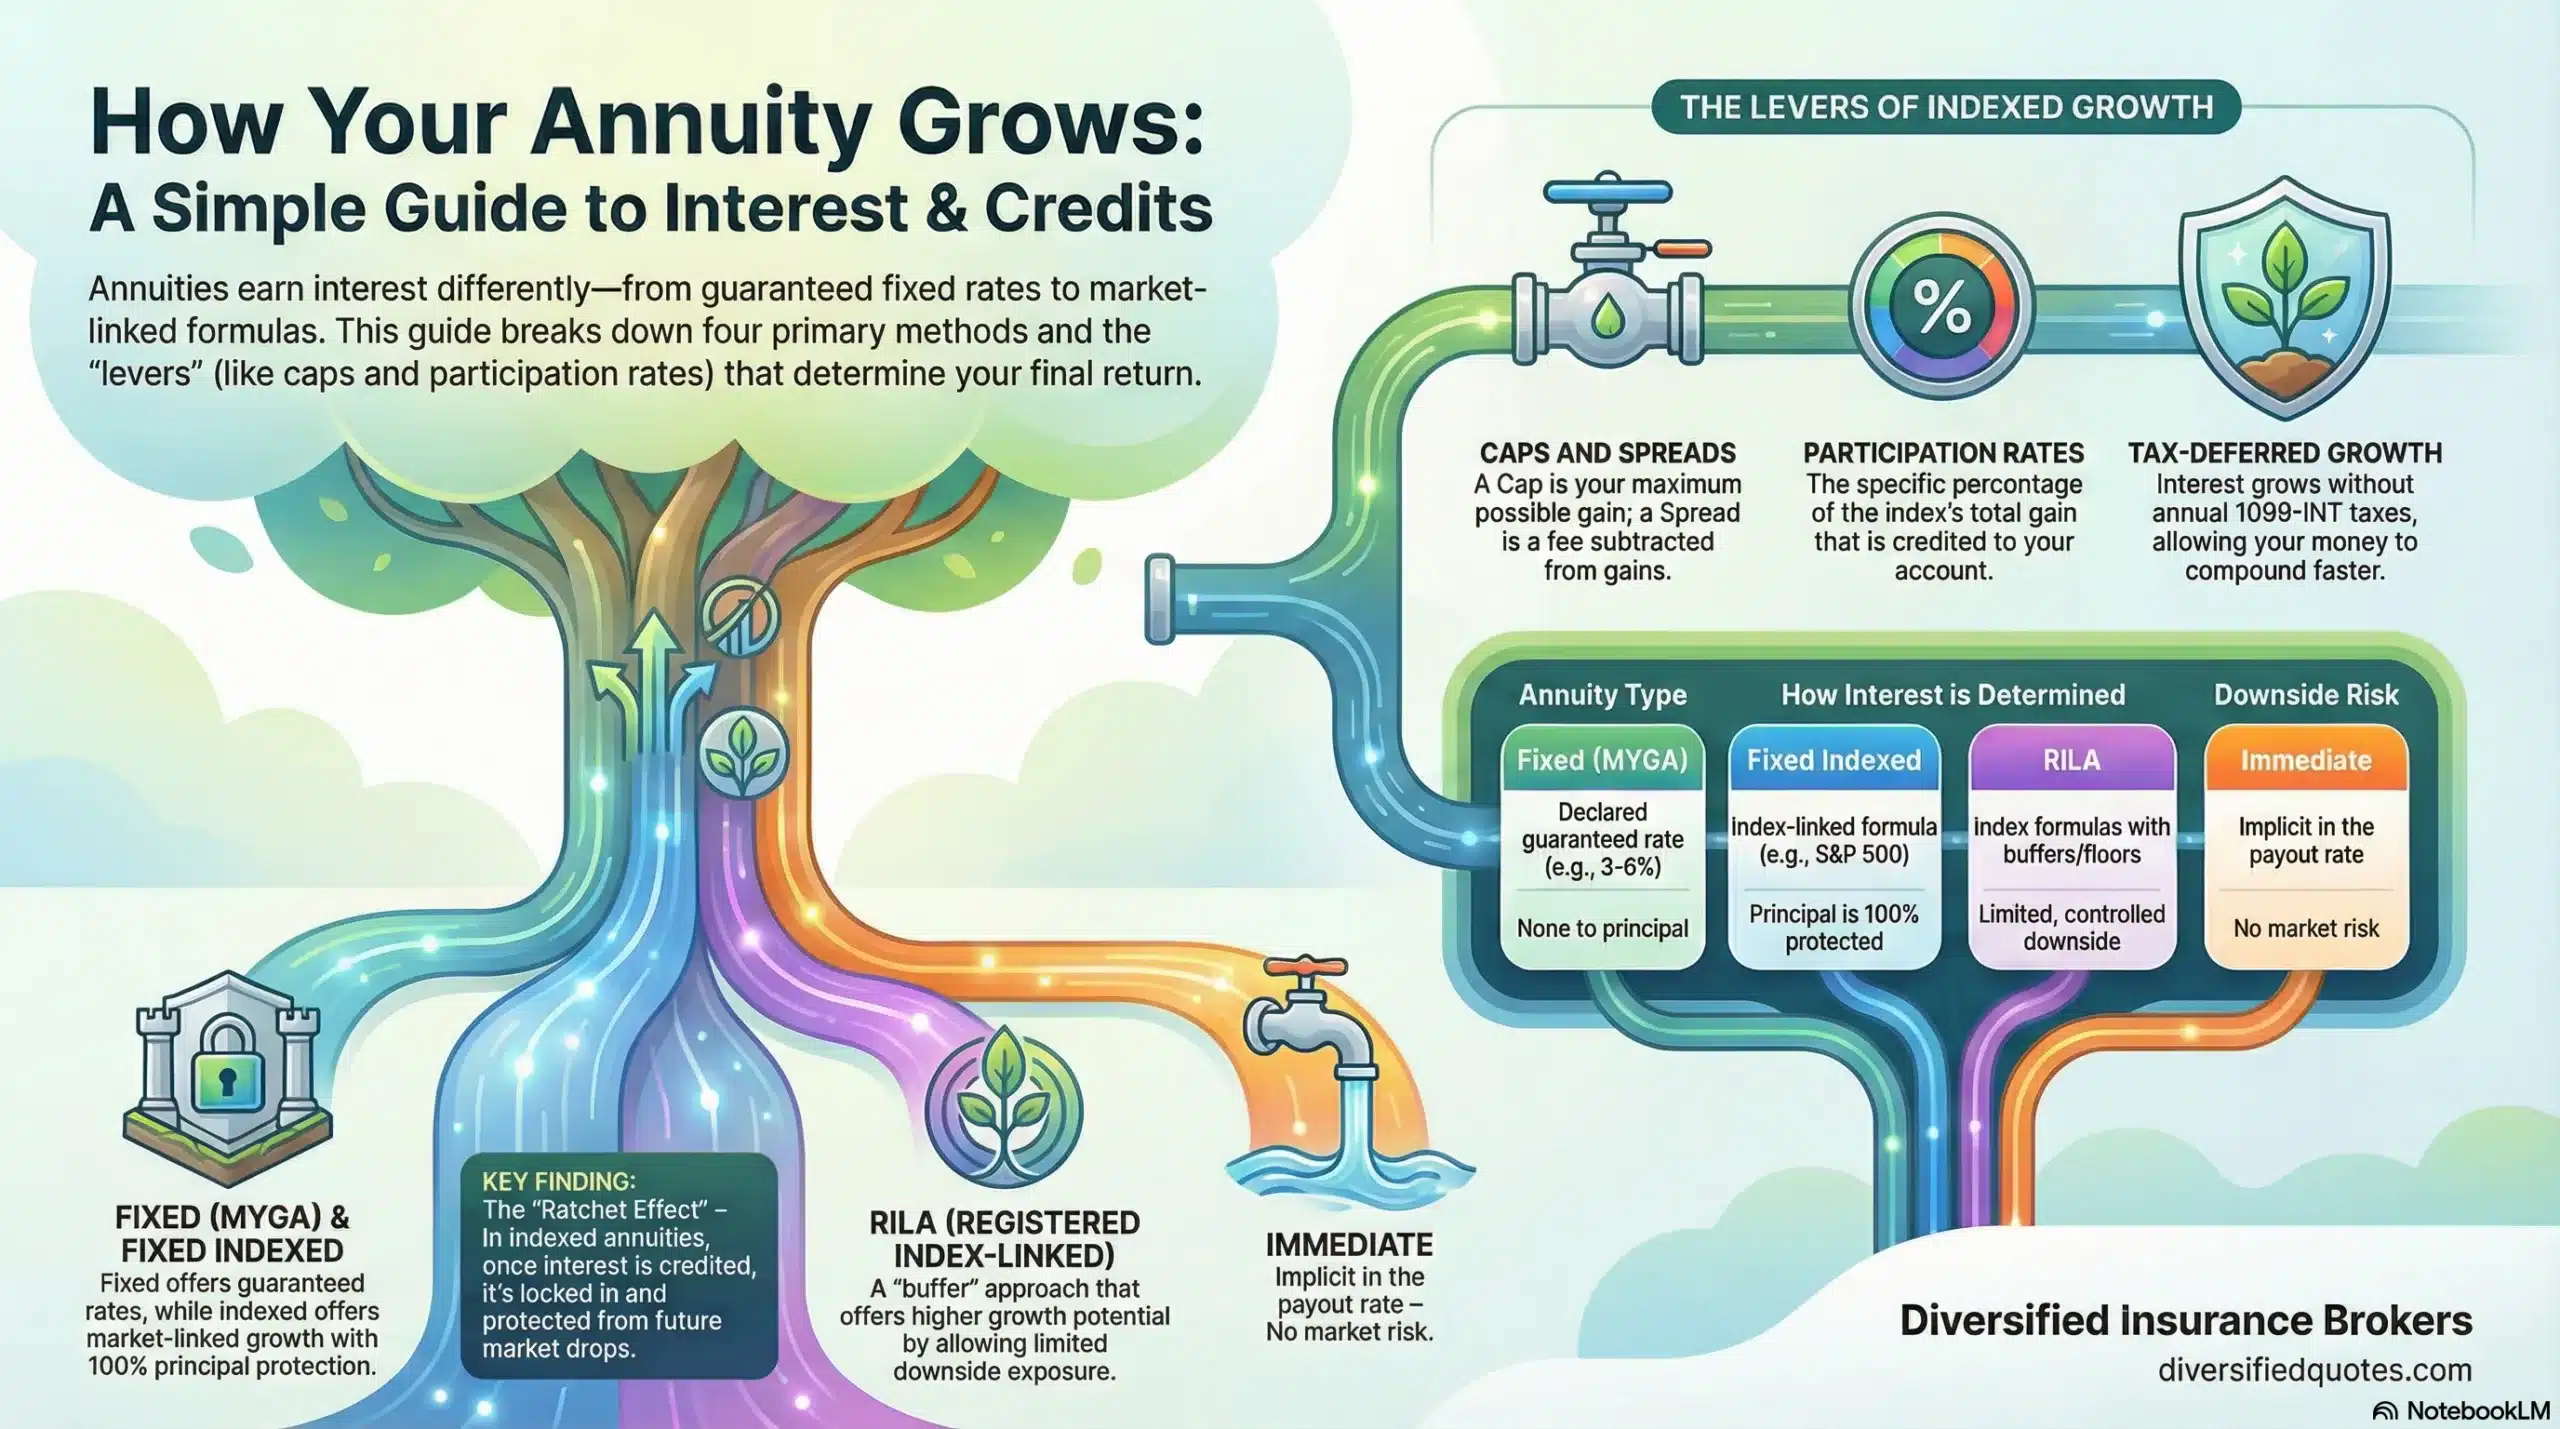
A cap rate sets the maximum credited interest for a given term regardless of how much the index gained. If the NASDAQ benchmark gains 28% in a year and the contract has a 12% annual cap, the credited interest for that term is 12% — not 28%. The excess gain above the cap belongs to the insurer’s options hedging structure. A cap does not mean the product is deceptive; it means the carrier structured the guarantee and the growth limit together as a package, and the cap is the cost of the 0% floor in negative years. Our resource on what is an annuity cap rate covers how to interpret and compare caps across different products and index options.
A participation rate credits a defined percentage of the measured index gain rather than capping at an absolute number. A 50% participation rate on a 28% NASDAQ index gain produces 14% credited interest. A 75% participation rate on the same gain produces 21%. Participation rates may feel more intuitive than caps in strong years, but they also limit the credit in moderate-gain years that might have hit a cap on an alternative strategy. The right comparison between a cap-based and participation-based strategy depends on expectations for how the index will perform and how frequently gains will approach or exceed the cap threshold.
A spread subtracts a defined margin from the measured index gain before interest is credited. A 3% spread applied to a 10% measured NASDAQ gain produces 7% credited interest. A 3% spread applied to a 4% measured gain produces 1%. Spreads can be advantageous when index gains are large and consistent, but they reduce credits proportionally in modest-gain environments. Some NASDAQ-linked annuity options combine these controls — a participation rate with a floor, or a cap with a minimum guaranteed credit — which is why reading the contract benefit schedule rather than relying on the index name is the only reliable comparison approach.
The 0% Floor — What It Does and What It Does Not Do
The 0% floor is the feature that distinguishes a NASDAQ index in an annuity from direct NASDAQ investment. In a negative NASDAQ year under most fixed indexed annuity strategy terms, the contract credits 0% rather than reflecting the negative index return as a loss to the account balance. The account value does not decrease due to the index’s decline — subject to the strategy terms, the contract period rules, and any withdrawals taken during the term.
The value of the 0% floor is most visible in years of significant index decline. NASDAQ-heavy benchmarks have historically experienced sharp drawdowns — drops of 30–40% or more in extended bear markets — that would directly reduce a brokerage account’s balance. In an indexed annuity, those same periods produce a 0% credit rather than a direct principal loss. Over multiple years, the combination of growth in positive periods and preservation in negative periods produces a different experience than direct investment — one that many pre-retirees and retirees find valuable because it reduces the behavioral pressure of watching account balances decline.
Our resource on sequence of returns risk covers why the 0% floor is particularly valuable near retirement — because the sequence in which returns occur matters as much as the average return when withdrawals are being taken from the portfolio. A year of 0% credit in an indexed annuity has dramatically different consequences than a year of -30% in a brokerage account when combined with systematic withdrawals, because the 0% year does not reduce the base from which future growth compounds. This is the structural benefit that makes NASDAQ-linked indexed annuities appealing for retirement income planning even when direct NASDAQ investment would theoretically provide higher average returns.
NASDAQ vs. S&P 500 as an Annuity Index — The Comparison Framework
Many indexed annuities offer both NASDAQ-linked and S&P 500-linked index options, and the comparison between them is one of the most common questions in annuity product evaluation. The comparison is not simply “which index performs better” — it is about how the different volatility and growth characteristics of each benchmark interact with the carrier’s crediting method and growth controls to produce different credited interest outcomes in different market environments.
NASDAQ-linked benchmarks are generally more concentrated in growth and technology sectors and exhibit higher volatility than the broadly diversified S&P 500. Higher volatility means larger swings in both directions — which can produce larger credited interest in strong up years (subject to caps and participation) and more frequent 0% credits in down years. The S&P 500 is broader and includes a wider range of industries including value sectors, financials, and consumer staples, which historically produced smoother but still meaningful long-term growth. In annuity crediting terms, the S&P 500’s lower volatility typically allows carriers to offer somewhat higher caps or participation rates because the options hedging cost is lower for a less volatile benchmark. Our resource on what is an S&P 500 index in an annuity covers the parallel framework for how that benchmark functions in the annuity crediting structure.
The practical comparison question is not which index is better in isolation — it is which index option, with its specific crediting method and growth controls, produces the better expected outcome given the applicant’s time horizon and market expectations. In many cases, a well-structured S&P 500 option with a higher cap or stronger participation rate may produce better expected credited interest than a NASDAQ option with a tighter cap — even in years when the NASDAQ benchmark outperforms the S&P 500 — because the higher cap on the S&P option captures more of that index’s gain. Comparing these options side-by-side with realistic market scenarios rather than relying on the index name is the analysis that produces useful insights.
NASDAQ Annuity Index Strategies and Retirement Income Planning
Many clients who evaluate a NASDAQ index in an annuity are doing so in the context of retirement income planning — not just accumulation. When income is part of the objective, the index choice is important but not the dominant variable. The income rider mechanics — how the income base grows, what payout percentages apply at different start ages, what fees are charged annually, and what happens to the income base and account value after income begins — often have more impact on the eventual monthly income amount than whether the accumulation phase was linked to a NASDAQ index or an S&P 500 index.
Our resource on what is a GLWB covers the guaranteed lifetime withdrawal benefit structure that most income-focused indexed annuities use, and our resource on how a GLWB works covers the mechanics of how income amounts are calculated and what happens over the income-distribution period. Our resource on how much income do I need in retirement covers the retirement income framework that anchors the decision of how much of a retirement plan should be allocated to a guaranteed income annuity structure versus flexible investment assets. And our resource on guaranteed income from annuities covers the specific annuity structures — including indexed annuities with income riders — that produce guaranteed lifetime income as the primary planning objective.
The mental model that serves most clients well is to separate the accumulation engine from the income engine: the NASDAQ index option (or any index option) drives the credited interest that builds account value during the accumulation phase, while the income rider’s rules and payout percentages determine how that accumulated value converts into lifetime income when the distribution phase begins. Clients who focus only on the index option and ignore the rider mechanics often miss the variables that matter most for the actual monthly income they will receive. Our resource on pension alternative covers how indexed annuities with income riders can function as a private-sector pension replacement — the framing that best captures why many clients choose this structure regardless of which index option they select for the accumulation phase.
Renewals, Declared Rates, and Long-Term Planning Implications
One of the most important long-term realities of any NASDAQ annuity index strategy is that the cap rates, participation rates, and spreads declared at contract issue are typically not guaranteed for the full surrender period. Most indexed annuities have declared renewal rates that the carrier resets at the beginning of each new term within contractually defined ranges. This means a cap rate of 12% at contract issue may renew at 10% or 8% in a future term if prevailing interest rates, options costs, or the carrier’s hedging economics change. The carrier’s renewal rate history — how it has treated existing policyholders at renewal relative to what it offers new applicants — is one of the most important carrier selection criteria that most product comparisons underemphasize.
The practical implication is that product evaluation should not be based solely on the initial declared rates. A product with strong initial rates and a carrier with a poor renewal track record may underperform a product with modest initial rates and a carrier known for favorable renewal treatment over the policy’s full accumulation period. Our resource on are annuities a good investment covers the long-term value assessment framework that includes renewal behavior as a key evaluation criterion. Our resource on common annuity myths addresses the most frequently heard misunderstandings about how indexed annuity rates work over time — including the belief that initial crediting terms persist unchanged for the full surrender period.
Who a NASDAQ-Linked Indexed Annuity Is Built For
A NASDAQ index in an annuity is most valuable for clients who want the potential benefit of a growth-oriented benchmark’s upside, expressed through a structured crediting process with a principal-protection floor, rather than through direct market ownership. This typically describes pre-retirees in the 5–15 years before retirement who want to build accumulation with some market-linked upside but who cannot afford to absorb significant drawdowns that would compromise their retirement timeline. It also describes retirees in the early years of retirement who want continued growth potential while protecting against the sequence of returns risk that makes large early-retirement drawdowns particularly damaging to long-term portfolio sustainability.
The fit is strongest when the client’s liquidity needs align with the annuity’s surrender schedule. An indexed annuity is not designed for funds that may be needed in the next three to five years. The surrender charge schedule — which applies if withdrawals exceed the annual free-withdrawal amount during the surrender period — reflects the long-term nature of the commitment. Clients who need liquidity flexibility should ensure that the indexed annuity represents an appropriate portion of their overall portfolio rather than committing all assets to a product structure with limited liquidity in the near term. Our resource on the Annuities Hub covers the major annuity categories and helps clarify where a NASDAQ-linked indexed annuity fits within the broader annuity product landscape.
How to Compare NASDAQ Annuity Strategies — A Practical Framework
When comparing two indexed annuities that both offer a NASDAQ index option, the comparison should move through four practical areas rather than stopping at the index name. First, confirm the crediting method: annual point-to-point, monthly average, monthly sum, or multi-year point-to-point produce different results in the same market environment. Second, examine the growth control: is it capped, participation-based, spread-based, or some combination, and where are those controls currently set? Third, review the liquidity terms: surrender charge schedule, free-withdrawal percentage, and whether there are any exceptions for specific life events or healthcare needs. Fourth, if income is part of the plan, examine the rider mechanics in detail: rollup rate, payout percentage at the expected income start age, rider fee, and what happens to the income guarantee if the account value depletes.
Illustrations that show hypothetical credited interest based on historical index performance are useful starting points but should be interpreted carefully. Historical performance does not guarantee future results, and an illustration that uses a particularly strong historical window for the NASDAQ index will show impressive hypothetical credited interest that may not reflect realistic expectations across the full range of possible future outcomes. The more useful analysis is to evaluate how the product performs across multiple scenarios — a strong NASDAQ year, a flat year, a down year, and a sustained drawdown — and to assess whether the credited interest under the contract’s current terms in each scenario still serves the retirement planning goal. Our resource on bonus annuity comparison covers how initial premium bonuses interact with indexed annuity crediting — relevant when NASDAQ-linked indexed annuities are being compared against bonus designs that offer upfront premium enhancements alongside indexed growth options.
Compare NASDAQ Strategies Against Fixed and Bonus Options
We compare real contract terms — crediting method, caps, participation, spreads, and liquidity — side by side with fixed-rate and bonus designs so the tradeoffs are clear before you commit.
NASDAQ Crediting & Mechanics
How NASDAQ index options earn interest, how crediting methods work, how caps and participation rates are applied, and how the S&P 500 compares as an alternative benchmark.
Compare Structures & Plan Fit
Benchmark NASDAQ strategies against fixed and bonus designs, understand income rider mechanics, and evaluate whether indexed annuities fit your retirement plan.
Financial Protection Essentials
Annuity fundamentals, sequence of returns protection, guaranteed income design, pension alternatives, and retirement income planning resources.
Talk With an Advisor Today
Choose how you’d like to connect—call or message us, then book a time that works for you.
Schedule here:
calendly.com/jason-dibcompanies/diversified-quotes
Licensed in all 50 states • Fiduciary, family-owned since 1980
FAQs: NASDAQ Index in an Annuity
Am I investing in NASDAQ if my annuity is linked to it?
No — and this distinction is one of the most important things to understand before evaluating any indexed annuity. When a fixed indexed annuity references a NASDAQ index, the index functions as a measuring benchmark inside the contract’s crediting formula, not as an investment you own. You do not purchase shares of any NASDAQ-listed companies through the annuity. You do not receive dividends from those companies. You cannot trade or access the underlying holdings. Your account value does not move up and down daily with the NASDAQ index the way a brokerage account holding a NASDAQ-linked fund does. Instead, the insurance carrier measures how the NASDAQ index moves over a defined crediting term, applies the contract’s growth controls (cap, participation rate, or spread) to that measured movement, and credits the resulting interest amount to your account. If the measured result is positive, your account grows by the credited amount and that gain is locked in. If the measured result is negative, most NASDAQ index annuity strategies credit 0% for that term rather than reducing your account balance. You are not trading direct market ownership for annuity credits — you are using a contract structure that references a market benchmark while protecting principal from negative index periods. Our resource on how a fixed indexed annuity works covers the complete product mechanics in detail.
Do NASDAQ-linked annuities include dividends in the interest calculation?
Most NASDAQ index annuity strategies credit interest based on price index movement — not total return including dividends. This means that the dividends paid by NASDAQ index component companies do not flow through to your credited interest calculation. This is one of the most frequently misunderstood aspects of indexed annuity crediting and one of the clearest differences between owning a NASDAQ-linked fund and holding a NASDAQ-linked indexed annuity. In a direct fund investment, dividends are distributed to shareholders or reinvested, contributing meaningfully to total return — particularly in longer holding periods where dividend reinvestment compounds. In an indexed annuity, the carrier captures the dividend equivalent yield as part of the options cost structure that supports both the index-linked crediting and the principal protection guarantee. The dividend value is essentially priced into the options strategy that allows the carrier to offer a 0% floor in negative index years. This is not a hidden deduction — it is the economic tradeoff that makes the guaranteed downside protection possible. Clients who understand this tradeoff can evaluate it honestly: they are giving up dividend participation in exchange for the 0% floor and the contract’s other guarantees. Whether that tradeoff makes sense depends on the specific planning goal, the time horizon, and how important guaranteed principal protection is relative to maximum return potential.
What happens if the NASDAQ index goes down during my term?
In most NASDAQ index annuity strategies, a negative measured index result for the crediting term produces a 0% credit for that term — not a negative return that reduces your account balance. Your principal is generally protected from market losses within the strategy terms, subject to the contract’s rules and any withdrawals you take during the term. This 0% floor is one of the defining characteristics that separates an indexed annuity from direct market investment. In a brokerage account, a NASDAQ decline of 30% directly reduces your account value by 30%. In an indexed annuity with a 0% floor, the same 30% NASDAQ decline produces a 0% credit for the term — your account value stays where it was at the start of the term (adjusted for any withdrawals, rider fees, or other contract charges). The protection against negative index years is particularly meaningful in the context of retirement planning, where a large portfolio loss early in retirement can permanently impair income sustainability. Our resource on sequence of returns risk covers why the 0% floor matters structurally for retirement income plans — not just as a comfort feature but as a mechanism that protects the compounding base from which future credited interest accumulates.
Why do NASDAQ strategies often have lower caps than S&P 500 strategies?
NASDAQ-linked benchmarks are generally more volatile than the broadly diversified S&P 500, and that higher volatility increases the cost of the options strategy the carrier uses to deliver the indexed crediting structure. Insurance carriers use options — specifically call options on the relevant index — to provide the upside-linked credit while maintaining the ability to offer the 0% floor guarantee. More volatile indexes require more expensive options to hedge, which means the carrier can allocate less of its options budget to a higher cap or higher participation rate on a NASDAQ strategy than on a less volatile S&P 500 strategy. This is why two otherwise similar annuity products might offer a 12% annual cap on an S&P 500 point-to-point option and only a 9% cap on a NASDAQ point-to-point option, even though the NASDAQ index has historically produced larger gains in strong years. The cap reflects the cost of hedging the volatility, not a judgment about the index’s quality. Clients who understand this relationship can make a more informed choice between the two options: the NASDAQ option may credit the cap in strong years and produce 0% in down years, while the S&P 500 option with a higher cap may capture more of the S&P 500’s gain in moderate-gain years even if the S&P 500 itself gained less than NASDAQ in those same periods. Our resource on what is an annuity cap rate covers how to interpret and compare caps across different index options and product designs.
Is NASDAQ better than the S&P 500 in an annuity?
Not automatically — and the comparison is more nuanced than the index names suggest once you account for how crediting methods and growth controls interact with each benchmark’s characteristics. The NASDAQ benchmark has historically exhibited higher volatility and stronger performance in technology-driven bull markets, but it has also experienced sharper drawdowns. In an indexed annuity context, the relevant comparison is not which index produced higher total returns historically — it is which index option, with its specific crediting method and growth control, produces the better expected credited interest given realistic assumptions about future market behavior. A NASDAQ option with a 9% annual cap may underperform an S&P 500 option with a 13% cap in a year when NASDAQ gains 25% and the S&P 500 gains 18% — because the NASDAQ option hits its cap at 9% while the S&P 500 option credits 13%. In the same year, the S&P 500 option delivered more credited interest even though NASDAQ outperformed the S&P 500 by 7 percentage points. This illustrates why the growth control is as important as the index in the actual credited interest outcome. Our resource on what is an S&P 500 index in an annuity covers the parallel framework for the S&P 500 benchmark, and comparing both options under the specific contract terms of the products being evaluated is the only reliable way to identify which choice best serves the planning goal.
Can a NASDAQ-linked annuity be used for retirement income?
Yes — many indexed annuities offer optional income riders that allow the contract to provide guaranteed lifetime withdrawals alongside the index-linked crediting strategy. When income is part of the objective, the NASDAQ index option influences the credited interest that builds account value during the accumulation phase, while the income rider’s specific rules — rollup rate, payout percentage at the expected income start age, annual rider fee, and what happens to the income guarantee after account value depletion — determine how that accumulated value converts into monthly or annual income during the distribution phase. In many income-focused indexed annuity designs, the rider’s income base grows at a contractual rollup rate (often 5–7% annually) during the deferral period regardless of whether the index credits interest in any given year. This rollup rate is separate from and sometimes more predictable than the indexed crediting — meaning the income planning objective may be well-served by the rider mechanics even in years when the NASDAQ index strategy credits 0%. Our resource on what is a GLWB covers the guaranteed lifetime withdrawal benefit structure, and our resource on guaranteed income from annuities covers how different annuity structures produce guaranteed income for retirement planning.
How do I compare NASDAQ annuities to fixed-rate or bonus annuities?
The comparison starts with clarifying the planning goal, because the three product types are solving different problems and the “better” choice depends on what you are trying to accomplish. A fixed-rate annuity (also called a multi-year guaranteed annuity or MYGA) credits a declared interest rate for a defined term regardless of any index performance — providing maximum predictability and simplicity at the cost of limiting upside to the declared rate. A bonus annuity typically offers an upfront premium enhancement (bonus) that immediately increases the account value or income base, which can be valuable when the starting balance for future income calculations matters. A NASDAQ-linked indexed annuity offers market-linked upside potential through the crediting strategy with a 0% floor protecting against negative index terms — providing more growth potential than a fixed rate but more predictable downside protection than direct market investment. The comparison questions to ask are: What rate does the fixed annuity offer, and does the certainty of that rate outperform the realistic expected credited interest from the indexed option over the planned time horizon? Does the bonus annuity’s upfront enhancement offset any tradeoffs in the ongoing crediting terms? Does the indexed annuity’s growth potential justify the complexity and the variability in annual credited interest? Our resource on bonus annuity comparison covers the bonus design tradeoffs, and our resource on current fixed annuity rates provides the current fixed-rate benchmark for comparison.
About the Author:
Jason Stolz, CLTC, CRPC, DIA, CAA and Chief Underwriter at Diversified Insurance Brokers (NPN 20471358), is a senior insurance and retirement professional with more than 25 years of real-world experience helping individuals, families, and business owners protect their income, assets, and long-term financial stability. As a long-time partner of the nationally licensed independent agency Diversified Insurance Brokers, Jason provides trusted guidance across multiple specialties—including fixed and indexed annuities, long-term care planning, personal and business disability insurance, life insurance solutions, Group Health, Travel Medical and Evacuation Insurance, and short-term health coverage. Diversified Insurance Brokers maintains active contracts with over 100 highly rated insurance carriers, ensuring clients have access to a broad and competitive marketplace.
His practical, education-first approach has earned recognition in publications such as VoyageATL, and contributions from his agency featured in Kiplinger and GoBankingRates— highlighting his commitment to financial clarity and client-focused planning. Drawing on deep product knowledge and years of hands-on field experience, Jason helps clients evaluate carriers, compare strategies, and build retirement and protection plans that are both secure and cost-efficient. Visitors who want to explore current annuity rates and compare options across multiple insurers can also use this annuity quote and comparison tool.
Browse More Resources: Return to our complete Fixed Indexed Annuity Products & Education guide — covering FIA products and education from top carriers.
Last Reviewed: August 25, 2026 |
Reviewed by: Jason Stolz, CLTC, CRPC, DIA, CAA
Chief Underwriter, Diversified Insurance Brokers, Inc. | NPN: 20471358 | Diversified Insurance Brokers, Inc. — Licensed in all 50 states
Fact Checked by: Tonia Pettitt, CMIP©
Medicare Specialist, Diversified Insurance Brokers, Inc. | NPN: 14374308 | Diversified Insurance Brokers, Inc. — Licensed in all 50 states
Did you find this content helpful? Leave us a Google review — it helps others find trustworthy guidance too.
Editorial Standards: Diversified Insurance Brokers maintains rigorous editorial standards to ensure accuracy, clarity, and independence in all content. Learn more about our editorial standards and commitment to transparency.
