
Index Annuity Crediting Methods
Index Annuity Crediting Methods

Jason Stolz CLTC, CRPC, DIA, CAA
The crediting method inside a fixed indexed annuity is one of the most consequential design elements in the entire product — and one of the least discussed during the sales process. Most people shopping for indexed annuities focus on cap rates, premium bonuses, and income rider roll-up rates. These matter. But the crediting method determines how the annuity actually measures index performance and translates it into interest credited to your account, which means two contracts linked to the exact same index, with the exact same cap rate, can produce materially different results over five or ten years simply because they calculate gains using different formulas and different measurement windows. Understanding crediting methods is not a technical detail for specialists — it is the foundational literacy that separates informed annuity buyers from those who discover surprises in their contract after it is too late to change anything.
At Diversified Insurance Brokers, we work with more than 100 carriers and access more than 1,000 annuity products. When we run side-by-side comparisons for clients, crediting method analysis is always part of the framework — because the same premium placed in two different crediting structures on the same index can produce a 15% to 25% difference in accumulated value over a 10-year period depending on what market conditions actually occur. Our resource on what a fixed indexed annuity is provides the foundational product overview, and our guide on how a fixed indexed annuity works explains the principal protection and index-linking mechanics that define the product category. This page goes deeper into the specific measurement formulas that determine how much of the index’s movement actually ends up credited to your account. Understanding how to choose the correct indexes in an annuity is also an essential aspect of the annuity that is right for you.
Ensure you are receiving the absolute top rates
Current Fixed Annuity Rates
Compare today’s best fixed annuity rates from top carriers.
Current Bonus Annuity Rates
See which annuities offer the highest upfront bonus today.
Request an Annuity Quote
Submit our annuity request form to get personalized rate options.
Lifetime Income Calculator
Use our calculator to see how much guaranteed income your annuity can provide.
What a Crediting Method Actually Does
Before examining specific crediting structures, it is worth being precise about what a crediting method determines. It defines three things: when the index is measured, how the measurement is used to calculate a gain percentage, and how that gain percentage interacts with the contract’s rate parameters — cap, participation rate, or spread — to arrive at the interest credited to your account at the end of the crediting period. It does not determine whether your principal is safe if the market declines. That protection is structural to the annuity product itself, independent of the crediting method. Regardless of which crediting structure you select, if the index finishes lower than it started at the measurement point, your contract is credited 0% rather than a negative return — this is the floor guarantee that defines a fixed indexed annuity’s principal protection.
What the crediting method does determine is how much of the index’s positive movement you capture when markets rise — and how that capture is affected by the specific pattern of gains and losses over the measurement period. A market that rises 20% in a single dramatic surge and then gives back 5% behaves differently under annual point-to-point measurement than under monthly sum measurement. A market that grinds steadily higher month by month produces different relative outcomes across the same two methods. This is the core reason why crediting method selection is not simply a matter of finding the “best” option — it is a matter of matching the measurement structure to realistic expectations about market behavior during your holding period, and understanding what you are giving up in one scenario to gain advantage in another.
The crediting method also interacts directly with the rate parameters applied to the gain measurement. Cap rates, participation rates, and spread rates each function differently depending on the crediting structure they are attached to. A 7% annual cap on a point-to-point structure is a completely different economic proposition than a 2% monthly cap on a monthly sum structure, even though 2% monthly sounds smaller than 7% annual. Understanding how these rate parameters work within each crediting structure — not in isolation — is the analysis that reveals whether one contract’s terms are genuinely more favorable than another’s for a given market scenario.
Annual Point-to-Point: The Baseline Standard
Annual point-to-point is the most widely used crediting method in the fixed indexed annuity market, and it is the appropriate starting reference for understanding all other methods by comparison. The mechanics are straightforward: the index value is recorded on the first day of the contract year (the “starting point”), and recorded again on the last day of the contract year (the “ending point”). The percentage change between those two values is calculated. If the change is positive, it is adjusted by the applicable cap, participation rate, or spread, and the resulting adjusted percentage is credited as interest to your account. If the change is zero or negative, 0% is credited — your account value is preserved exactly where it was.
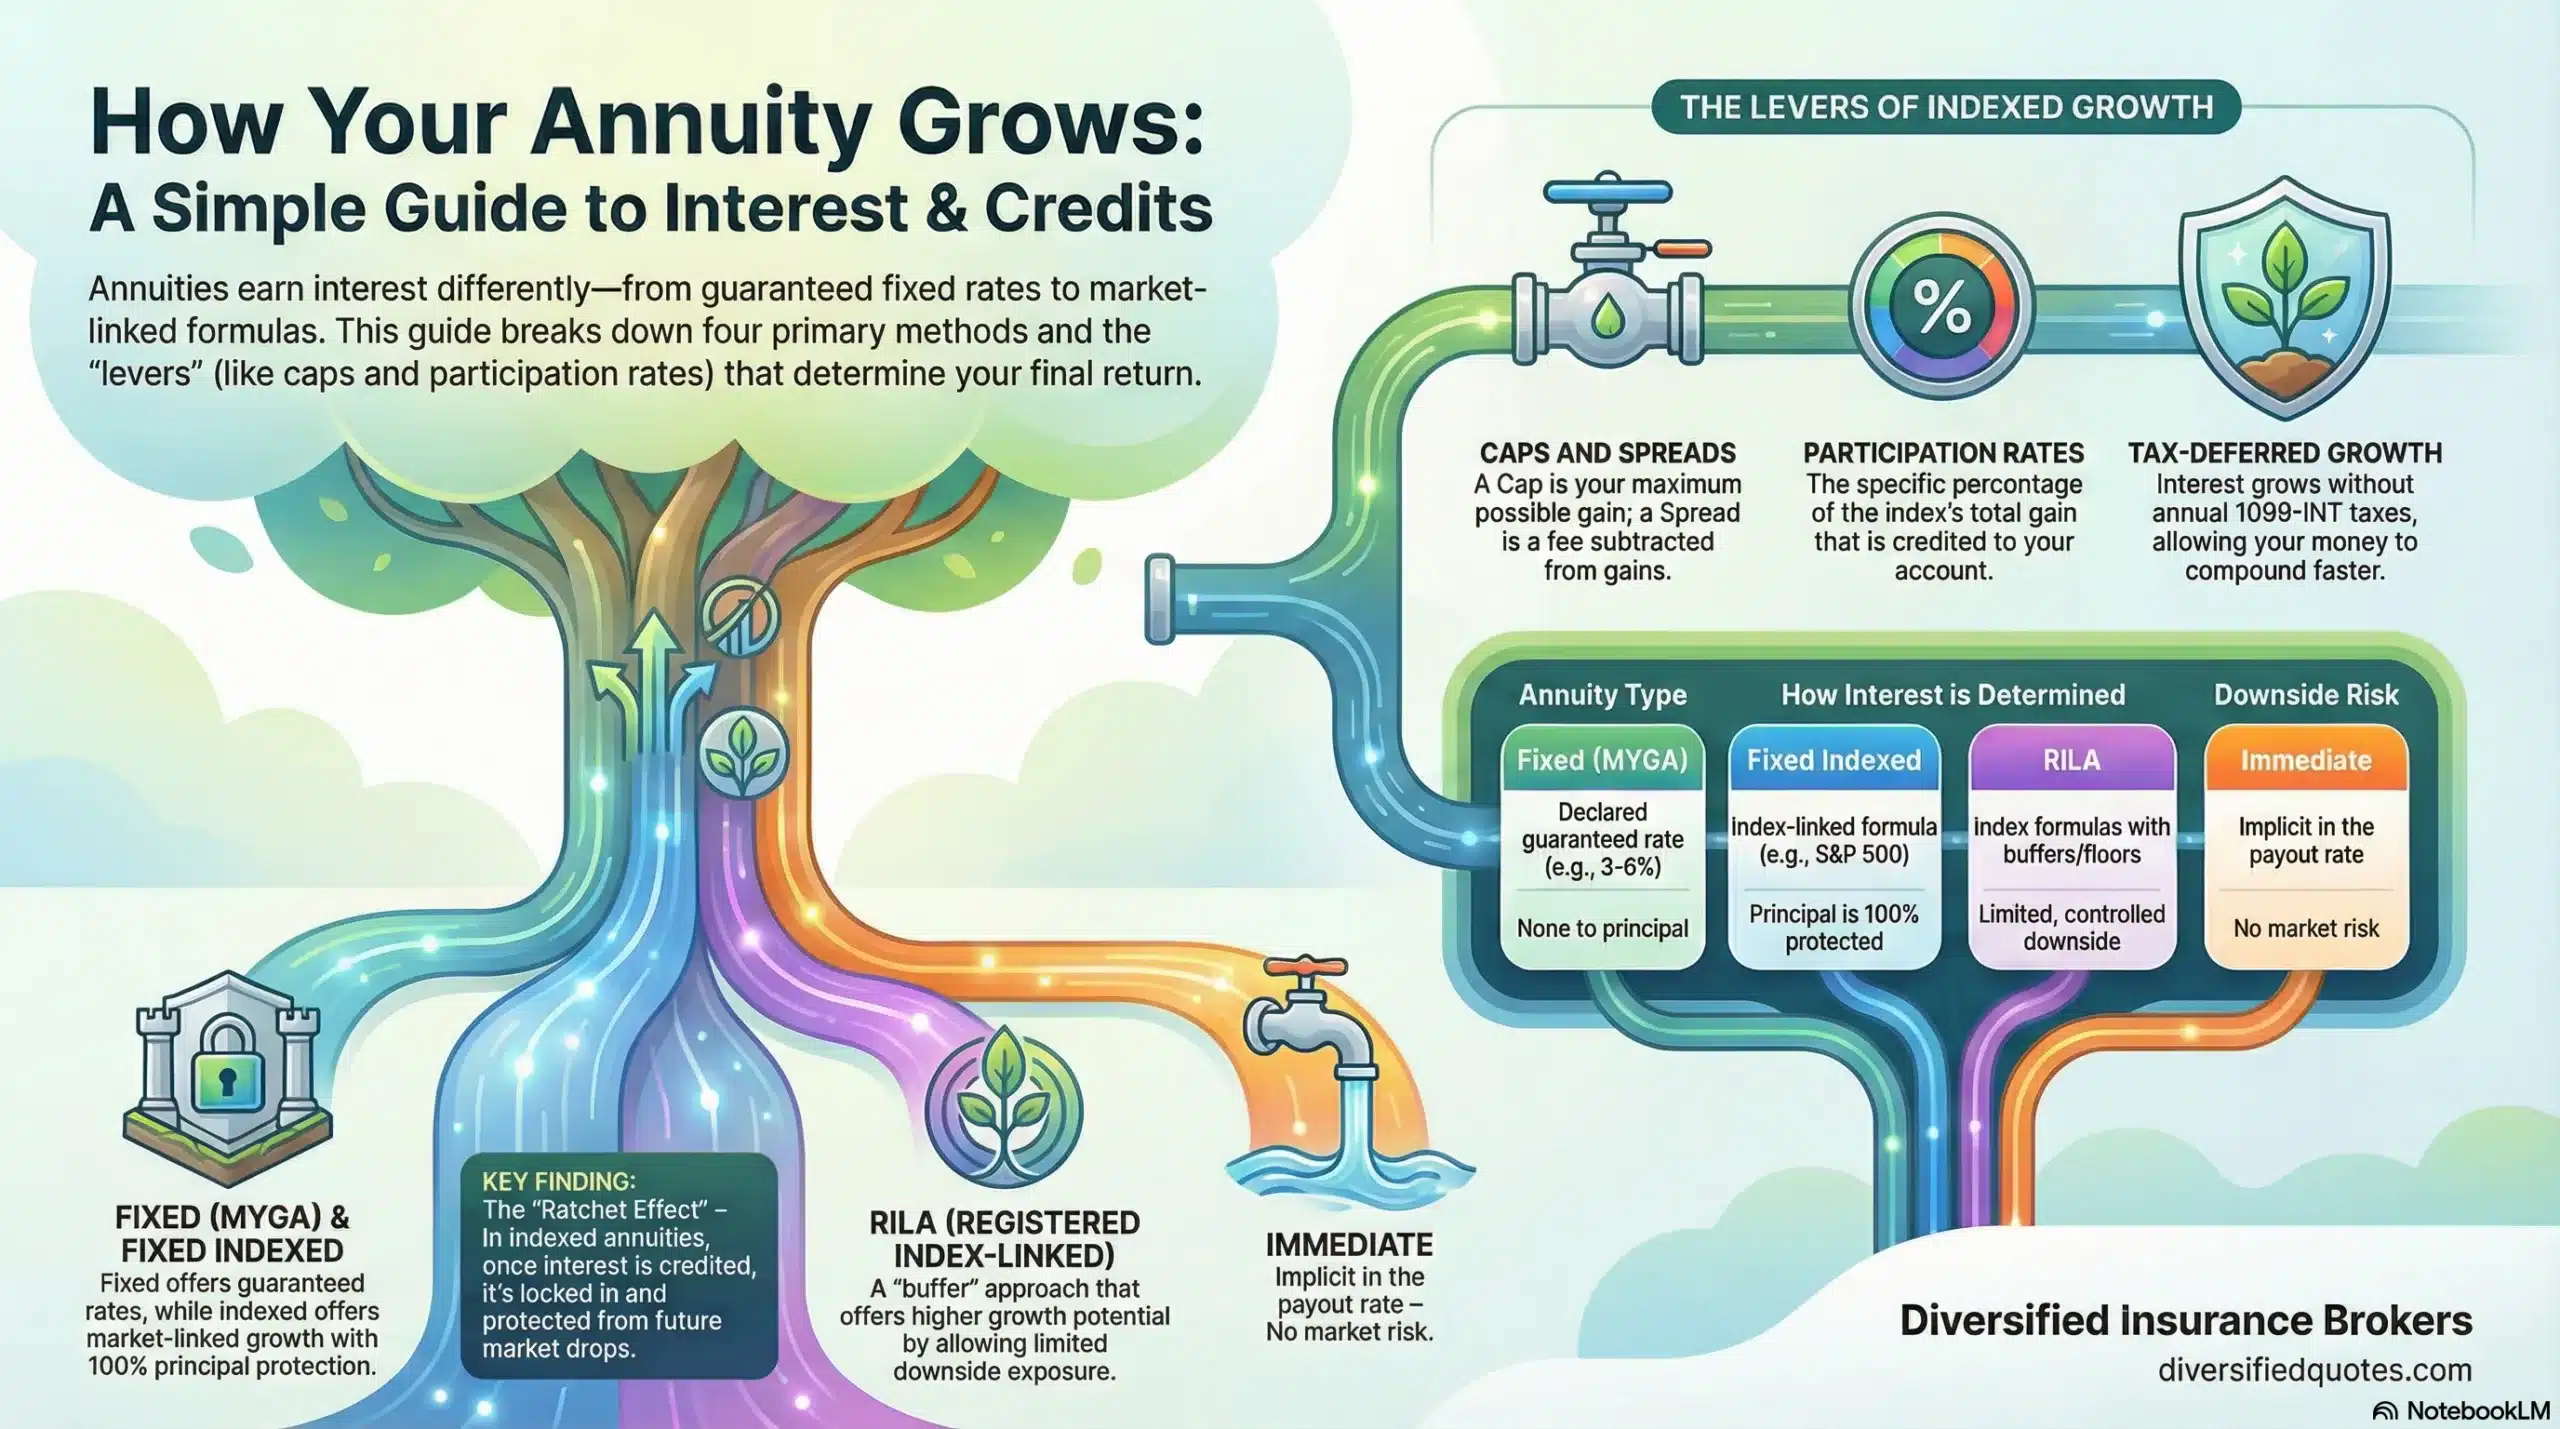
The simplicity of this design is its primary advantage. It is transparent, easy to verify, and easy to understand when reviewing a contract anniversary statement. The annual reset feature — where the ending point for one year becomes the starting point for the next — means that each contract year begins fresh. A year of strong gains gets locked in permanently; the following year starts from the new, higher base regardless of whether markets subsequently decline. This ratchet effect is one of the most structurally valuable features of indexed annuity design because it prevents the recovery problem that plagues traditional equity portfolios: the requirement to regain lost ground before new gains become net positive.
The limitation of annual point-to-point is that it measures performance at only two moments — the start and end of the year — and the path between those two moments is entirely irrelevant to your credited interest. A market that rises 15%, falls back to its starting point, and then finishes 8% above where it started produces an 8% gain in your crediting calculation (subject to cap). A market that rises 30% in the first six months and then gives back 22% also produces an 8% gain. And a market that simply moves up 8% gradually all year produces the same 8% — subject to the same cap. Path independence is a feature in falling market scenarios (mid-year drops are irrelevant if the year ends positive) but a limitation in strongly rising markets where the cap prevents full participation. Our resource on what an annuity cap rate is explains how the annual cap interacts with this gain calculation and why cap renewal rates matter as much as initial caps for long-term outcomes.
Monthly Sum: Capturing Monthly Movement with a Monthly Cap
The monthly sum crediting method measures the index’s percentage change each calendar month, applies a monthly cap to each month’s result, and then sums the twelve monthly capped values to determine the annual credit. The fundamental structural difference from annual point-to-point is that each month’s gain is separately capped — meaning that no single month’s surge can produce more than the monthly cap in that month’s contribution to the annual total. The sum of twelve capped monthly readings becomes the credited interest for the year, floored at 0% so that a year with significant negative months that outweigh the positive months does not produce a negative return.
The monthly sum method tends to produce stronger results than annual point-to-point in markets characterized by steady, distributed monthly gains — markets where gains are spread relatively evenly across the calendar year rather than concentrated in a few large single-month moves. When the S&P 500 rises 12% over a year through consistent 1% monthly gains, a monthly sum strategy with a 2% monthly cap captures all of that movement because no individual month exceeds the monthly cap. In contrast, annual point-to-point with a 10% cap would also capture the full 12% but be limited to 10% by the cap — giving the monthly sum structure a potential edge in moderate steady-growth environments.
The monthly sum structure becomes less favorable in markets with volatility — large positive months followed by large negative months. Even if the year ends strongly, the negative months subtract from the running total before the annual floor is applied. A year where the index falls 8% in one month (which contributes -8% to the running sum before hitting 0%), then rises significantly through the remaining months, may produce a lower credited amount under monthly sum than under annual point-to-point — even if the calendar year ending value shows a similar gain. The monthly cap also limits upside in strongly trending months. Our resource on whether fixed indexed annuity rates change covers how monthly and annual caps are reset at renewal and what to watch for when caps decline.
Monthly Average: Smoothing Through Multiple Observation Points
The monthly average method takes twelve monthly index readings — typically at the end of each calendar month — averages them together, and compares that average to the index value at the start of the contract year. If the average is higher than the starting value, the percentage gain is adjusted by the applicable cap, participation rate, or spread, and the result is credited as interest. If the average is lower than or equal to the starting value, 0% is credited.
The averaging effect smooths extreme volatility in both directions. A market that spikes dramatically in one or two months and then retreats will produce a monthly average that reflects the full year’s price behavior rather than being captured in a single high ending point. Conversely, a market that declines early in the year but rallies strongly to a high year-end value may produce a monthly average that is lower than the year-end value — meaning the monthly average method captures less of the gain than annual point-to-point would have for the same year. The smoothing effect is symmetrical: it reduces both the peaks and troughs of what gets reflected in the crediting calculation.
Monthly average tends to perform relative to annual point-to-point based on the shape of the market’s path within each year. When markets trend consistently upward throughout the year, the monthly average will typically be below the year-end value — the early months’ lower values pull the average down relative to the final reading, so annual point-to-point captures a higher gain. When markets are volatile — rising and falling throughout the year before ending at a specific level — monthly average may capture a comparable or higher gain than annual point-to-point because it avoids being penalized by a single poor-month ending value.
Multi-Year Point-to-Point: Extending the Measurement Window
Multi-year point-to-point strategies extend the measurement period from one year to two, three, or five years. The index value is measured at the beginning and at the end of the multi-year term — the same point-to-point logic but applied over a longer horizon. Because the carrier is making a longer-term commitment, these strategies often come with more attractive rate parameters: higher participation rates, uncapped participation in some designs, or higher cap rates than comparable one-year structures offer. The trade-off is that interest is credited once at the end of the multi-year term rather than annually.
The extended measurement window creates both opportunity and risk. Opportunity: a multi-year participation rate of 150% on a two-year period might capture 1.5 times the S&P 500’s two-year gain — which in strong bull market periods can produce meaningful accumulation. Risk: the two-year measurement means that if the market falls significantly in year one and recovers in year two, you may receive a lower credit than two consecutive annual point-to-point measurements would have produced — because the annual reset that locks in gains each year doesn’t apply within a multi-year term.
Multi-year strategies are most appropriate for investors with genuine long time horizons who are not concerned with year-by-year statement values and are comfortable with the possibility that mid-period market declines are not locked out before the end of the term. They also require careful attention to how surrender schedules align with the crediting period — a five-year crediting term inside a ten-year surrender schedule means the contract structure and the crediting measurement window both need to be understood together. Our resource on annuity surrender charges explained covers the surrender schedule dimension that multi-year crediting strategy selection must account for.
Explore Every Crediting Strategy
Browse by measurement period, crediting method, or rate formula.
Measurement Period — How Long Before Interest Is Calculated
Crediting Method — How the Index Is Measured
Rate Formula — How Much of the Gain You Keep
See the Full Menu Overview →Cap, Participation Rate, and Spread: How Rate Parameters Shape Outcomes
| Rate Parameter | How It Works | Example (10% Index Gain) | Best Environment |
|---|---|---|---|
| Cap Rate | Sets the maximum interest that can be credited in a period regardless of index gain | 7% cap = 7% credited (index gain of 10% is capped at 7%) | Moderate growth years where index gains stay near or below the cap |
| Participation Rate | Credits a defined percentage of the index gain with no separate ceiling | 80% participation = 8% credited (80% of 10% index gain) | Strong bull markets where index gains exceed what capped strategies would allow |
| Spread Rate | Subtracts a fixed percentage from the index gain before crediting the remainder | 2.5% spread = 7.5% credited (10% index gain minus 2.5% spread) | Very strong market years where the spread is outpaced by large gains; disadvantageous in flat years |
| Uncapped / 100% Participation | Credits 100% of index gain with no ceiling — full index participation | 10% credited on 10% index gain | Any positive market — but typically applies to volatility-controlled indexes with lower inherent returns |
None of these rate parameters is inherently superior — each reflects a different trade-off between the carrier’s risk management economics and the contract owner’s upside participation. Cap rates are the most common and most transparent: you know the ceiling going in, making the maximum annual outcome calculable. Participation rates are more favorable in strongly trending markets because there is no ceiling — 80% of a 25% gain is 20%, whereas a 10% cap would limit you to 10% of that same 25% gain. Spread rates are essentially an expense charge on gains — they favor the contract owner most in strongly rising years when the spread is a small fraction of the total gain, and least in flat years where a 2.5% spread on a 3% index gain leaves only 0.5% credited.
Volatility-Controlled and Proprietary Indexes
The most significant structural development in the fixed indexed annuity market over the past decade has been the proliferation of proprietary and volatility-controlled index strategies. These are not the S&P 500 or NASDAQ — they are indices constructed specifically for use in annuity products, typically using rules-based methodologies that adjust equity exposure based on realized or implied market volatility. When market volatility rises above defined thresholds, the index algorithm reduces equity exposure by shifting allocation toward fixed income or cash components. When volatility falls, the algorithm increases equity exposure. The result is an index that experiences lower peak gains and shallower drawdowns than unmanaged broad market indices.
The reason volatility-controlled indexes matter for crediting method analysis is that they change the rate parameter trade-off. Because the index itself suppresses volatility, carriers can offer higher participation rates — sometimes 100% or above — or uncapped structures on these indexes without bearing the same option cost as they would on raw S&P 500 exposure. A contract offering 140% participation on a volatility-controlled index may sound dramatically more attractive than 85% participation on the S&P 500, but the underlying index’s volatility control typically produces lower absolute gains than the S&P 500 in strong bull markets — meaning the higher participation rate may not translate into higher credited amounts. Understanding the historical return behavior of the specific proprietary index is essential before comparing it to traditional S&P 500-linked options on the basis of participation rate alone.
The indexes used in major carriers’ products — such as the various BlackRock, PIMCO, and carrier-specific proprietary indices offered by Allianz, American Equity, Athene, North American, and others — each have their own methodology, backtested history, and volatility target. Evaluating them requires understanding the index construction, not just the participation rate attached to it.
Allocation Flexibility: Splitting Across Multiple Crediting Strategies
Most fixed indexed annuity contracts allow contract owners to allocate premium across multiple crediting strategies simultaneously rather than committing 100% to a single method. A common allocation might split premium between an annual point-to-point strategy linked to the S&P 500 (with a cap) and a volatility-controlled index strategy with a high participation rate — capturing different risk profiles across different market scenarios. Some contracts also allow a fixed declared rate bucket alongside indexed strategies, providing a predictable guaranteed return component within the same contract that functions like a mini-MYGA for the allocated portion.
Reallocation is typically permitted at each contract anniversary — allowing the contract owner to adjust the allocation across available strategies based on updated cap rates, participation rates, market outlook, or changed retirement timeline objectives. This reallocation flexibility is one of the most practically valuable features of indexed annuity design because it allows the strategy to evolve over the life of the contract rather than being locked into a single crediting structure chosen at purchase. The available strategies and reallocation terms are defined in the contract and vary by carrier. Our resource on fixed annuities vs. fixed indexed annuities provides the context for how declared-rate and index-linked strategies compare as components of a diversified annuity structure.
Crediting Methods in the Context of Income Riders
When an income rider is attached to a fixed indexed annuity, the crediting method’s impact on account value growth interacts with the benefit base mechanics in ways that matter for long-term retirement income planning. In most income rider designs, the benefit base grows at a guaranteed roll-up rate independent of index crediting performance. However, the step-up feature — where the benefit base “steps up” to match the account value if the account value grows above the benefit base on a contract anniversary — means that strong crediting performance can permanently increase the benefit base and therefore increase guaranteed lifetime income.
This interaction means that the crediting strategy choice is not just an accumulation question — it is an income question. A crediting structure that produces meaningfully higher account value growth during the deferral period may trigger step-ups that permanently increase the income calculation base, producing higher guaranteed income payments for life even though the benefit base’s roll-up rate is guaranteed regardless. Our resources on what an income annuity benefit base is, how annuity income riders work, and the best fixed indexed annuities with lifetime income riders provide the integrated analysis framework for evaluating crediting strategies within income-focused annuity designs.
How to Compare Crediting Strategies Effectively
The most common mistake in comparing indexed annuity crediting strategies is evaluating them using a single historical scenario or a single rate parameter in isolation. “This strategy has a 10% cap and that one has a 7% cap” tells you something, but not enough. The evaluation framework that produces reliable comparisons includes the crediting method, the rate parameter type (cap vs. participation vs. spread), the current rate level as of today, the renewal history showing how rates have changed over prior contract years, the index underlying the strategy, and how the strategy has behaved across multiple market environments including both strong and volatile years.
Carrier renewal history is particularly important because initial caps are often higher than sustained caps — a carrier that offers a 10% cap in year one to attract new premium may have a consistent renewal cap of 6% to 7% in years two through ten. A competing carrier with a 9% initial cap and a consistent 8% to 8.5% renewal history produces better long-term outcomes despite the lower initial rate. Without looking at renewal history across multiple crediting periods, it is impossible to project realistic long-term accumulation. This is exactly the kind of comparative analysis that working with an independent broker who has access to multiple carriers — and historical performance data across those carriers — provides versus going directly to a single company’s marketing materials. Our resource on getting a 2nd opinion on your annuity quote and our overview of the best fixed indexed annuity options across the market provide the comparative context for evaluating specific products against the full field of available alternatives. For clients who have already purchased an annuity and want to evaluate whether it remains the most appropriate vehicle, our annuity rescue plan addresses whether a 1035 exchange to a better-structured product makes sense given current surrender status.
Related Annuity Pages
Fixed indexed annuity mechanics, rate comparisons, and income strategies from Diversified Insurance Brokers.
Financial Protection Essentials
Retirement income strategy, annuity comparison tools, and rollover resources from Diversified Insurance Brokers.
Talk With an Advisor Today
Choose how you’d like to connect—call or message us, then book a time that works for you.
Schedule here:
calendly.com/jason-dibcompanies/diversified-quotes
Licensed in all 50 states • Fiduciary, family-owned since 1980
Frequently Asked Questions: Index Annuity Crediting Methods
Which index annuity crediting method performs best over time?
There is no single crediting method that consistently outperforms all others across every market environment — the “best” method depends on what market conditions actually occur during your holding period, which cannot be known in advance. Annual point-to-point tends to perform well in years with moderate to strong gains and captures the annual reset benefit that locks in each year’s gains permanently. Monthly sum tends to perform well in markets with steady distributed monthly gains but can underperform annual point-to-point in volatile years with large negative months. Monthly average smooths extreme volatility and may perform comparably to annual point-to-point in choppy markets but tends to lag in strongly trending upward markets. Multi-year strategies can produce strong results in sustained bull markets but sacrifice the annual reset protection that prevents mid-period drawdowns from eroding locked-in gains.
The most defensible approach is to understand how each method behaves in different market scenarios and match the selection to realistic expectations about likely market conditions over your specific holding period — rather than backtesting the method that would have performed best historically and assuming the past will repeat.
Can I change my crediting method after purchasing an indexed annuity?
Most fixed indexed annuity contracts allow reallocation among available crediting strategies at each contract anniversary. This flexibility is one of the practically valuable features of indexed annuity design — you are not permanently locked into a crediting structure chosen at purchase. At each anniversary, the contract owner can shift premium allocation between available options: different crediting methods (annual point-to-point, monthly sum, monthly average), different underlying indexes (S&P 500, proprietary volatility-controlled indexes, NASDAQ-linked strategies), and different rate parameter structures (capped, participation rate-based, spread-based). The available options and reallocation terms are defined in the specific contract, and the rates applied to each strategy are the rates in effect at the time of reallocation — not the rates from the original purchase date. Reviewing updated cap rates, participation rates, and spread rates at each anniversary and reallocating toward the most attractive available structure is a standard management practice for engaged indexed annuity owners.
Do crediting methods affect principal protection?
No. The crediting method is entirely separate from the principal protection guarantee that defines a fixed indexed annuity. Regardless of which crediting strategy you select — annual point-to-point, monthly sum, monthly average, multi-year, or any other — if the index performs negatively during the crediting period, your contract is credited 0% rather than a negative return. Your principal is preserved at its previous locked-in value. The crediting method only affects how positive index movement is measured and translated into credited interest. The principal protection floor is structural to the product and applies universally across all crediting strategies within the contract. This is what distinguishes a fixed indexed annuity from direct equity investment or variable annuities — you participate in upside through the crediting mechanism while being protected from downside through the product’s structural guarantee. Our resource on whether you lose your principal in an indexed annuity explains this protection in full detail.
What is the difference between a cap rate and a participation rate?
A cap rate sets the maximum interest that can be credited during a measurement period — a ceiling that limits upside regardless of how strongly the index performs. If the index rises 20% and your cap is 8%, you receive 8%. A participation rate defines the percentage of the index gain that is applied to your account, without a separate ceiling. If your participation rate is 80% and the index rises 20%, you receive 16% — 80% of the full 20% gain. In a strongly rising market, participation rates can produce higher credited amounts than cap rates because there is no ceiling, but they also produce proportionally lower credits in moderate gain years since a percentage is taken off all gains. Some contracts also use spread rates, which subtract a fixed percentage from the index gain before crediting the remainder.
The practical comparison depends on the specific market scenario: an 80% participation rate outperforms a 10% cap when the index rises above 12.5% (80% of 12.5% = 10%); below 12.5%, the 10% cap structure credits the same or more. For full analysis of each parameter, our dedicated resources on what an annuity cap rate is, what an annuity participation rate is, and what an annuity spread rate is cover each in full.
Are proprietary or volatility-controlled indexes safe?
Volatility-controlled and proprietary indexes are not inherently unsafe — but they are different from traditional broad market indexes in ways that are important to understand before allocating premium. These indexes use rules-based methodologies that adjust equity exposure based on realized or implied volatility, typically shifting between equity and fixed income or cash components as market volatility rises and falls. Because the index itself manages volatility internally, carriers can offer higher participation rates or uncapped structures — but the index’s volatility control also typically produces lower peak gains than unmanaged broad market indexes like the S&P 500 during strong bull market periods. A 140% participation rate on a volatility-controlled index that returns 5% in a strong market year produces 7% credited, while 85% participation on an S&P 500 index that returns 18% in the same year produces 15.3% credited. Understanding the historical return behavior of the specific proprietary index is essential for comparing it meaningfully to traditional index-linked options. Your principal remains protected from market losses regardless of which index is used — the floor guarantee applies universally.
How does the annual reset feature work and why does it matter?
The annual reset — also called the annual ratchet — is the mechanism by which gains credited at the end of each contract year are permanently locked in as the new starting baseline for the following year’s crediting calculation. When your contract credits 8% in year one, that 8% is added permanently to your account value, and year two’s crediting measurement begins from the new, higher balance. If the market declines in year two and you receive 0% credit, your account stays at its year-one-end value — the decline doesn’t reverse the gains already locked in. This is fundamentally different from a direct equity investment, where market declines reduce the portfolio value from previously earned gains. The annual reset means that indexed annuity gains from strong years are structurally protected from erosion in subsequent weak years, which is one of the most powerful long-term accumulation advantages of the indexed annuity structure compared to alternatives that expose gains to subsequent market risk.
About the Author:
Jason Stolz, CLTC, CRPC, DIA, CAA and Chief Underwriter at Diversified Insurance Brokers (NPN 20471358), is a senior insurance and retirement professional with more than 25 years of real-world experience helping individuals, families, and business owners protect their income, assets, and long-term financial stability. As a long-time partner of the nationally licensed independent agency Diversified Insurance Brokers, Jason provides trusted guidance across multiple specialties—including fixed and indexed annuities, long-term care planning, personal and business disability insurance, life insurance solutions, Group Health, Travel Medical and Evacuation Insurance, and short-term health coverage. Diversified Insurance Brokers maintains active contracts with over 100 highly rated insurance carriers, ensuring clients have access to a broad and competitive marketplace.
His practical, education-first approach has earned recognition in publications such as VoyageATL, and contributions from his agency featured in Kiplinger and GoBankingRates— highlighting his commitment to financial clarity and client-focused planning. Drawing on deep product knowledge and years of hands-on field experience, Jason helps clients evaluate carriers, compare strategies, and build retirement and protection plans that are both secure and cost-efficient. Visitors who want to explore current annuity rates and compare options across multiple insurers can also use this annuity quote and comparison tool.
Explore More Annuity Options: Browse our complete guide to What Is a Fixed Indexed Annuity? — covering FIA education, mechanics, crediting methods & indexed annuity strategies from 100+ carriers.
Last Reviewed: September 3, 2026 |
Reviewed by: Jason Stolz, CLTC, CRPC, DIA, CAA
Chief Underwriter, Diversified Insurance Brokers, Inc. | NPN: 20471358 | Diversified Insurance Brokers, Inc. — Licensed in all 50 states
Fact Checked by: Tonia Pettitt, CMIP©
Medicare Specialist, Diversified Insurance Brokers, Inc. | NPN: 14374308 | Diversified Insurance Brokers, Inc. — Licensed in all 50 states
Did you find this content helpful? Leave us a Google review — it helps others find trustworthy guidance too.
Editorial Standards: Diversified Insurance Brokers maintains rigorous editorial standards to ensure accuracy, clarity, and independence in all content. Learn more about our editorial standards and commitment to transparency.
