
What is an Annuity Cap Rate
As an Independent Annuity Broker, we compare rates across 100+ carriers and 1,000 different annuities— not just one company’s product offerings — to find the best fit for your goals.
What is an Annuity Cap Rate

Jason Stolz CLTC, CRPC, DIA, CAA
An annuity cap rate is the maximum interest a fixed indexed annuity (FIA) can earn during a specific crediting period — regardless of how strongly the underlying market index performs. If an annuity has an 8% annual cap and the index returns 12% for that term, the credited interest is limited to 8%. If the index returns 6%, the credited interest is 6% because it falls below the cap. If the index is negative, the credited interest is typically 0% for the period and the principal remains protected from market loss. Cap rates are one of the most important growth levers in a fixed indexed annuity because they directly determine the upside potential of the contract — and they clarify the fundamental design trade-off that defines these products: principal protection in exchange for a ceiling on what the index can contribute in strong years.
Many people hear “market-linked” and assume they will receive the full market return. A cap rate is precisely what prevents that — and precisely why FIAs occupy a different planning role than direct market investments. Understanding what interest rate an annuity earns and where that interest comes from is the foundation for evaluating any cap-based strategy. Cap rates don’t exist in isolation. The “best” cap depends on how the entire strategy is structured: crediting method, index choice, term length, participation rate, spread, and any rider costs that apply. That’s why we usually start with fundamentals like how annuities earn interest and how fixed indexed annuities work, then narrow the comparison to strategies that fit a specific time horizon, liquidity need, and risk tolerance.
At Diversified Insurance Brokers, we help clients compare cap-based strategies across multiple carriers, crediting terms, and index choices so the outcome matches the real goal — conservative accumulation, future income planning, or reducing portfolio risk heading into retirement. Fixed indexed annuity sales reached $57.5 billion in the first half of 2025 according to LIMRA, making FIAs the fastest-growing annuity category, which reflects a broad market recognition that the principal protection and index-linked growth trade-off addresses a genuine retirement planning need. But growth in a product category does not make every contract the right fit — which is precisely why understanding what a cap rate does and how to compare cap strategies is more valuable than simply shopping for the highest number.
Ensure you are receiving the absolute top rates
Current Fixed Annuity Rates
Compare today’s best fixed annuity rates from top carriers.
Current Bonus Annuity Rates
See which annuities offer the highest upfront bonus today.
Request an Annuity Quote
Submit our annuity request form to get personalized rate options.
Lifetime Income Calculator
Use our calculator to see how much guaranteed income your annuity can provide.
Cap Rate vs. Participation Rate vs. Spread — How the Three Levers Compare
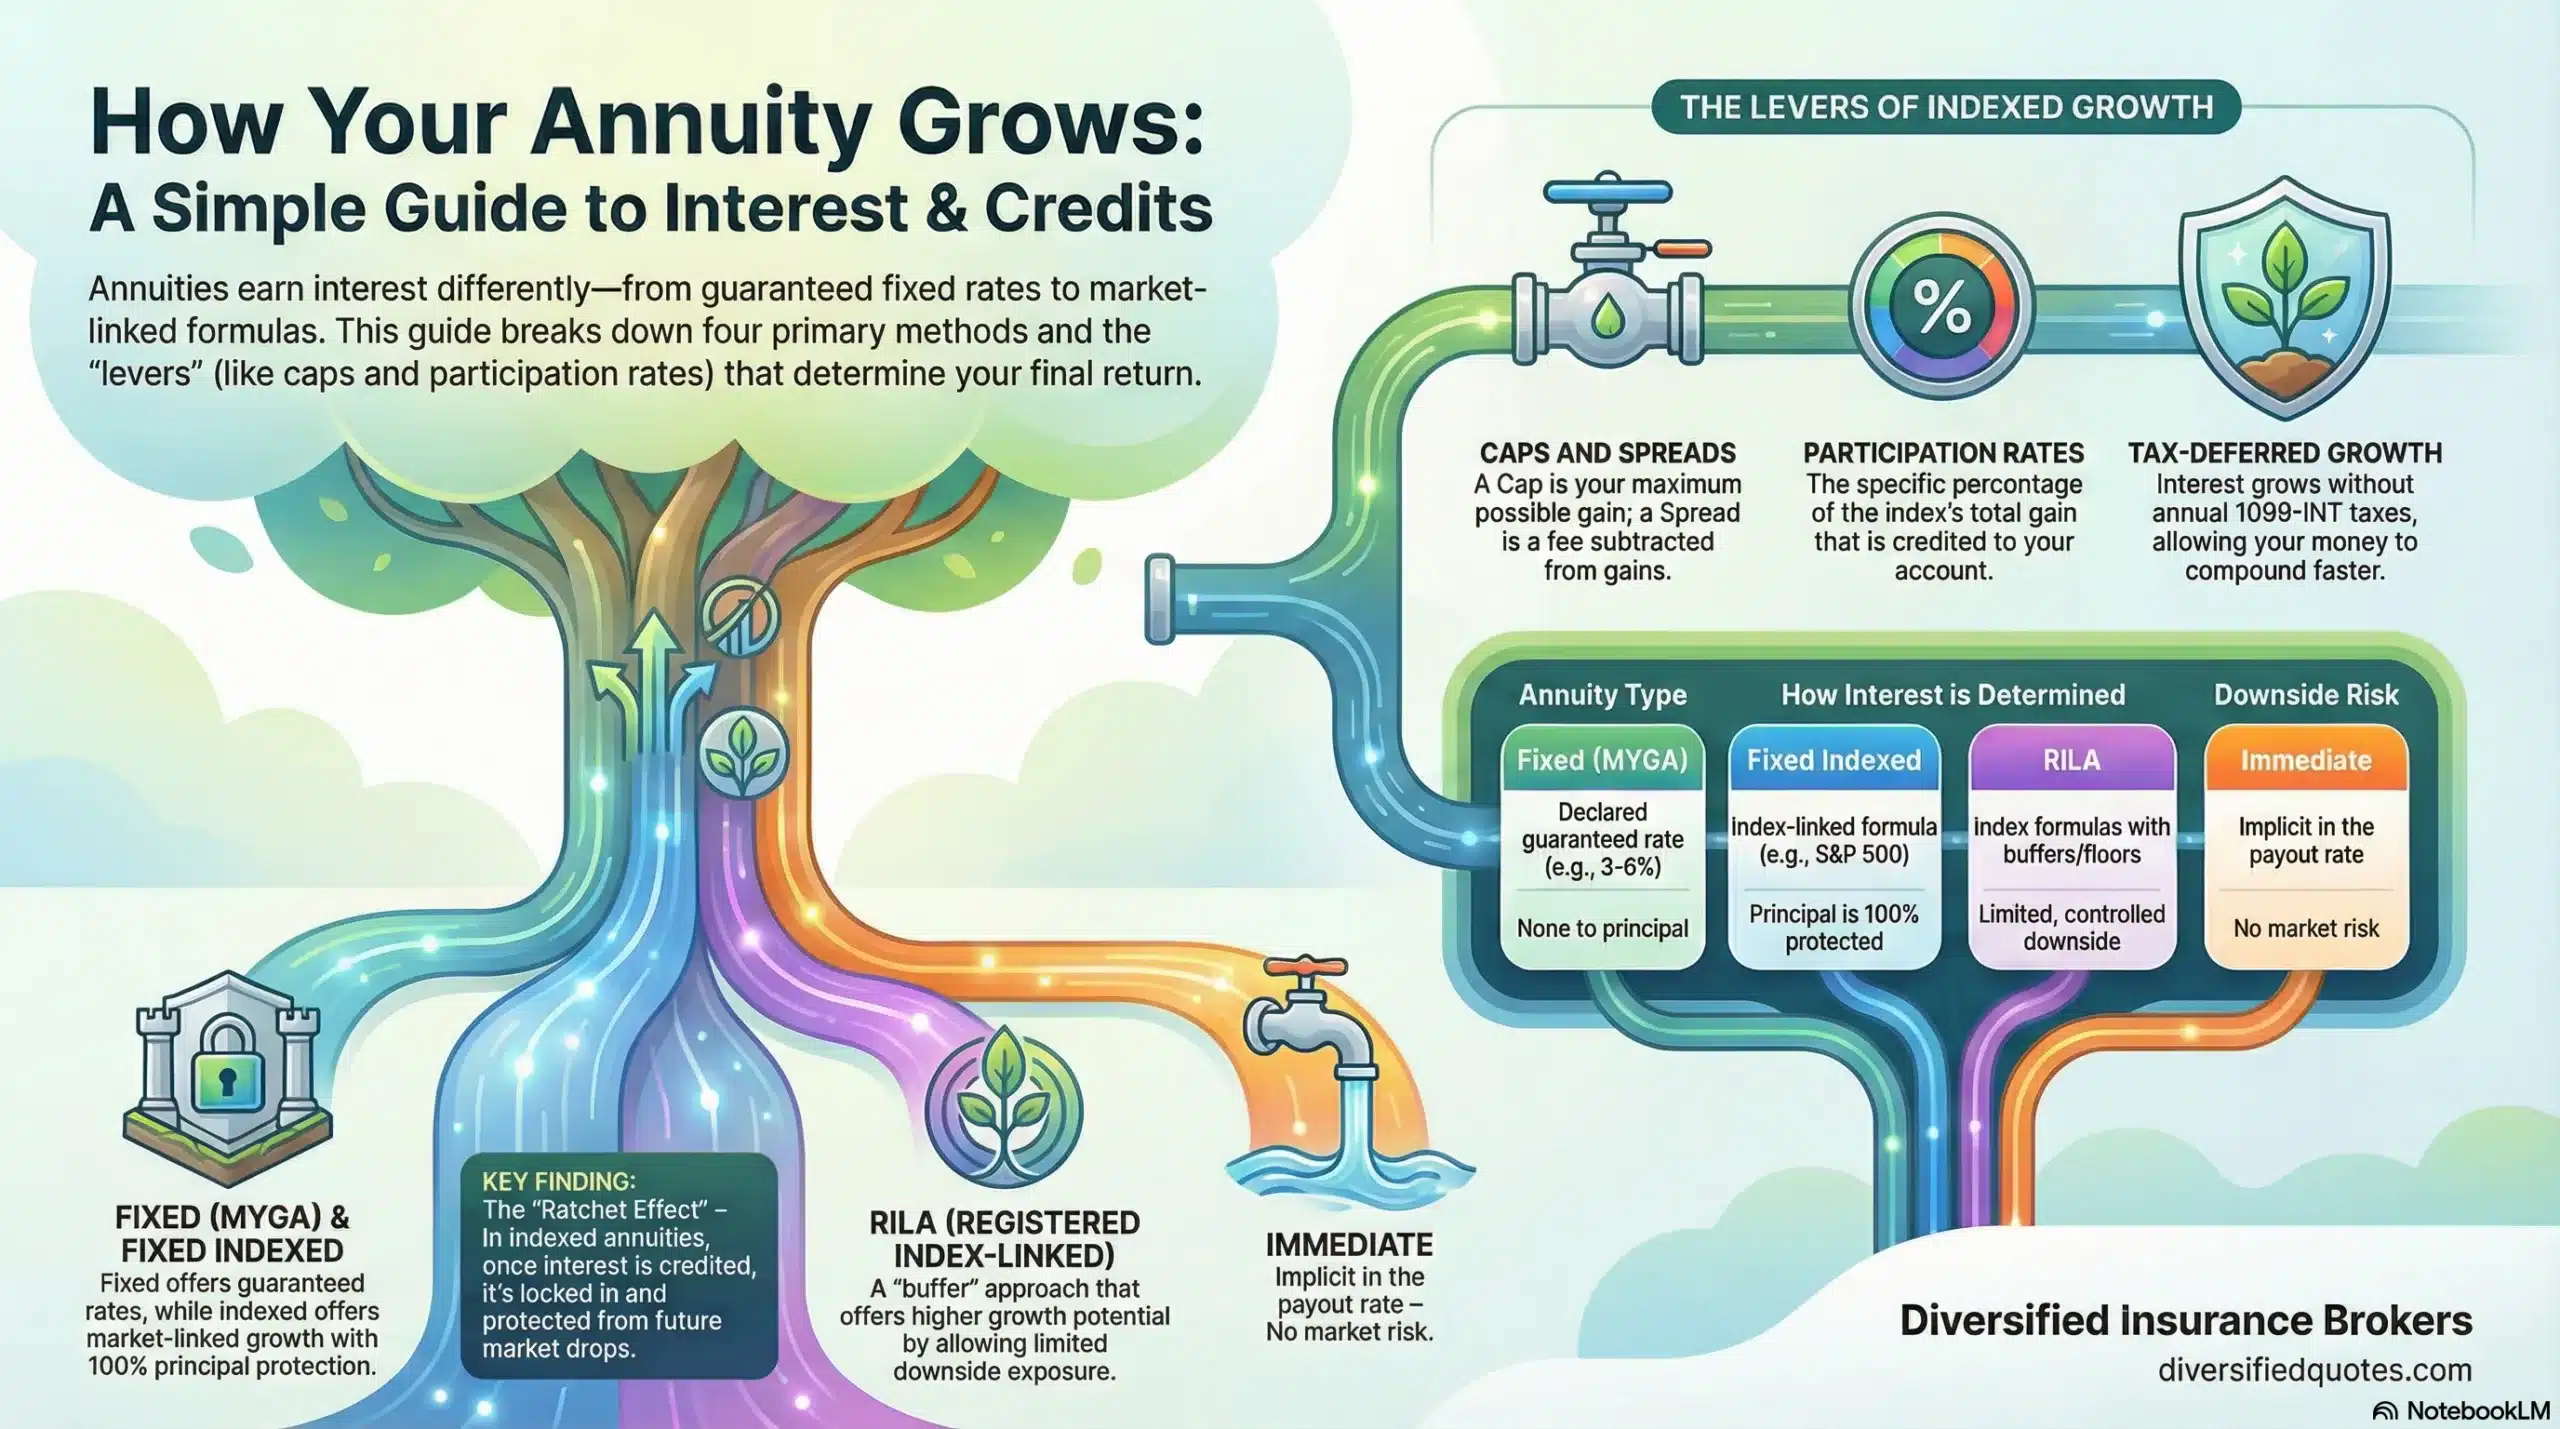
Before examining how each crediting mechanism works in depth, the table below maps the three primary levers that fixed indexed annuities use to determine how much of the index gain you receive — because understanding how they compare is the foundation for evaluating any specific strategy or carrier offer.
| Crediting Lever | How It Works | Example (Index Gains 10%) | Planning Consideration |
|---|---|---|---|
| Cap Rate | Sets a ceiling on credited interest for the term; any index gain above the cap is not credited to the account | 8% cap → credited interest is 8% (cap limits the full 10% gain); if index gains 6%, credited interest is 6% | Most transparent and intuitive structure; caps can renew annually — evaluate both the current cap and any minimum guaranteed cap in the contract |
| Participation Rate | Credits a defined percentage of the index gain; no hard ceiling, but the percentage determines how much of any gain you receive | 80% participation rate → credited interest is 8% (80% of 10%); participation above 100% is possible on certain volatility-controlled index strategies | Can outperform a cap in very strong markets if participation is high and no separate cap applies; compare participation strategies to cap strategies using multiple return scenarios, not one year |
| Spread (Margin) | Subtracts a fixed percentage from the index gain before crediting; if the result is positive you receive it; if negative you receive 0% | 2% spread → credited interest is 8% (10% minus 2%); if index gains 1.5% and spread is 2%, credited interest is 0% | Attractive in strong market years when the index gain far exceeds the spread; can produce 0% credited interest in modest gain years; typically paired with volatility-controlled or uncapped index strategies |
| Negative Index Period (All Methods) | When the index is negative, credited interest for that term is 0% — the principal is not reduced by index losses regardless of which crediting method is in use | Index falls 15% → credited interest is 0%; account value does not decline due to the index decline (withdrawals and rider fees, if any, may still affect account value) | This is the defining protection feature of all FIA crediting strategies — the 0% floor is what separates FIAs from direct market exposure and is the mechanism that funds the cap, participation, and spread pricing |
How an Annuity Cap Rate Works
A cap rate is a ceiling applied to the interest credited for a defined term. That term might be one year, two years, or another period depending on the strategy selected. Most FIAs offer multiple strategies within the same contract, and each strategy can carry its own cap. In the same annuity, you may see one strategy capped at 7% and another capped at 9% because the carrier prices each option differently based on the index chosen, volatility, hedging costs, and how the method calculates returns. The carrier uses a hedging budget — funded by the spread between what the general account earns and what principal protection requires — to purchase index options that create the index-linked growth potential. When that hedging budget changes, cap rates move with it.
The cap rate concept in plain terms: if the index has a very strong year, the cap limits how much of that strength you receive. If the index has a modest year below the cap, you generally receive the full gain. If the index is negative, the annuity credits 0% for that period and protects principal. This is why many people use indexed annuities as a “sleep at night” alternative to direct market exposure — you give up some upside in exchange for insulation from market declines. Understanding both sides of that trade-off, rather than focusing only on the cap number, is what leads to appropriate product selection. The broader picture of the benefits of annuities as retirement tools helps put the cap rate specifically in the right planning context.
Cap rates can also be stated in ways that cause confusion when people compare them casually. The most common structure is an annual cap on a one-year point-to-point strategy, but caps can also apply to multi-year terms or to methods that measure index changes differently across the year. The practical takeaway is simple: always verify what term the cap applies to and how the index change is measured before comparing cap rate numbers across strategies or carriers. A cap on a one-year point-to-point strategy is not directly comparable to a cap on a two-year strategy — the measurement windows and locking-in behavior are different.
Another critical factor is whether the cap is locked or renewable. Many FIAs allow the carrier to renew caps each year or at the end of each term, subject to contractual minimums. This is standard in the indexed annuity market and it is one reason to evaluate both the current cap and the minimum guaranteed cap, if stated in the contract. Two annuities can look similar today but behave very differently over time if renewal discretion and minimum guarantees differ between them.
Cap Rate, Participation Rate, and Spread — The Three Levers in Detail
Fixed indexed annuities use several mechanisms to determine how much interest you receive from index performance. Cap rates are one mechanism, but participation rates and spread rates are equally important because they can change outcomes significantly even when a cap looks attractive on paper. Understanding all three is essential before comparing strategies across carriers.
A participation rate means you receive a defined percentage of the index gain. If the participation rate is 70% and the index rises 10%, the starting point for your credited interest is 7% before any other rules apply. Participation can be below 100% or above 100% depending on the strategy and the index — some volatility-controlled index strategies offer participation rates above 100%, potentially crediting more than the index return in moderate gain years, though the index itself is designed to produce lower volatility than a standard price-return index. A spread subtracts a set percentage from the index gain before crediting. If the spread is 2% and the index rises 10%, the credited interest is 8%. If the spread is 2% and the index rises 1.5%, the credited interest is 0%. Small differences in spread levels can have meaningful long-term compounding effects because the subtraction applies in every positive year, not just strong ones.
A strategy might use only a cap, only a participation rate, only a spread, or combinations of these mechanisms. Some strategies combine participation with a cap. Others use a spread without a cap. The point is not to determine which lever is universally “best” — it is to evaluate which lever set produces the behavior you want for the role this annuity will play in your plan over your intended holding period. Reviewing how annuities earn interest in detail helps translate these mechanics into real examples across different market scenarios.
Cap Rates and Crediting Methods — Why the Measurement Window Matters
The way index change is measured matters as much as the cap itself. Cap rates appear most commonly in one-year point-to-point strategies because the measurement is straightforward: compare the index at the start and end of the year, then apply the cap to the gain. But many FIAs also offer strategies where the cap interacts with the crediting method differently and where the measurement window creates meaningfully different outcomes in the same market environment.
A monthly sum strategy, for example, may add monthly gains subject to a monthly cap and typically ignore monthly losses — which can produce very different results than an annual point-to-point in volatile markets where months alternate between gains and losses. A monthly average strategy may average index levels across the term rather than comparing a single start and end point, which tends to smooth the measured gain in strongly trending markets but can also reduce the credited amount in steadily rising markets. Multi-year strategies use longer measurement periods and different cap structures, which means gains and losses are locked in at the end of the full multi-year term rather than annually — a significant structural difference with meaningful implications for how the annuity behaves during the holding period.
When evaluating “what crediting behavior do you want?” rather than “what is the highest cap?”, the answer depends on how you plan to use the annuity. Some people want smoother, steadier crediting with annual lock-ins. Others accept multi-year terms if the potential upside improves. The right strategy is not universal — it depends on how the annuity fits within the broader retirement plan and what the realistic range of outcomes looks like across different market environments.
Why Carriers Adjust Cap Rates
Cap rates move because carriers are pricing a promise. The carrier uses a portion of the premium to support principal protection and contract guarantees, and then uses a hedging budget tied to general account yields and option costs to support index-linked interest potential. When hedging costs change — driven by interest rates, market volatility, and broader capital market conditions — caps can change. In general terms, higher interest rate environments can support higher caps because the general account yields provide a larger budget for the index options that create the upside potential. Higher volatility increases option costs, which can pressure caps lower. Carrier-specific risk management, reserve requirements, and product design philosophy also matter, which is one reason cap rates differ between carriers even for strategies that reference the same index.
This is why a fixed indexed annuity is not evaluated like a CD or a bond. It is a packaged set of guarantees and rules, and the right evaluation question is “Does this strategy fit my goal and timeline?” — not “Who has the highest cap today?” Today’s cap is not the only cap that matters. Many FIAs renew caps each year, meaning the cap you receive at purchase may not be the cap that applies in years two, three, or five of the contract. That is why strong comparisons also consider the contractual minimum guaranteed cap, the carrier’s renewal history, and how renewal discretion is structured in the specific contract. For current comparisons, our resource on fixed indexed and income annuity rates tracks current competitive offerings across product types.
Guaranteed Minimum Caps vs. Renewal Caps
One of the most overlooked questions in FIA evaluation is: what is the minimum guaranteed cap? Not every contract states a minimum cap on every strategy. Even when a minimum is stated, it may be meaningfully lower than the current cap. The purpose of a minimum cap is not to promise strong growth — it is to give you a contractual floor that the carrier cannot reduce below for that strategy, regardless of what happens to hedging costs or interest rates during the contract’s life.
In practical terms, three answers matter when evaluating any cap-based strategy. First: what is the cap today? Second: how often can it change and under what process? Third: what is the minimum guaranteed cap, if any? Two products that look identical today can behave very differently over a 10-year holding period if one has a meaningful minimum guaranteed cap and the other does not. A slightly lower current cap paired with a stronger minimum and better renewal history may be the superior long-term choice compared to a strategy with a higher current cap and no stated minimum. Evaluating annuities through a retirement annuity calculator that models both current and floor-level cap scenarios helps illustrate how much that difference can matter over the full holding period.
Cap Rates and Principal Protection — The Trade-Off Explained
The cap rate is not an arbitrary number. It represents the priced trade-off for providing a 0% floor in negative index years. The insurer’s ability to offer principal protection — the guarantee that a negative index year does not reduce the account value — comes from investing premium in the general account, where the yield generates the budget for the hedging program. The cap is the ceiling that results from what that hedging budget can support at current market conditions. If you want more upside potential, you typically have to accept less protection, more variability, or a different pricing structure — which is the reasoning behind RILA (buffered annuity) designs that accept some defined downside in exchange for higher caps or participation rates.
This is also why some investors compare cap-based FIAs to multi-year guaranteed annuities. A MYGA offers a known interest rate for a known term with no index variability — you know exactly what the account will grow to. A cap-based FIA offers the potential to do better than a MYGA in certain markets, but without guaranteeing that result in any given term. Whether you can lose principal in an indexed annuity is a question with a clear answer from index performance: you cannot, because of the 0% floor. Understanding that distinction helps clarify why FIAs attract investors who want principal protection with growth potential beyond a fixed rate — and why the cap is the mechanism that makes the protection affordable. For side-by-side comparisons of current fixed annuity rates alongside FIA cap environments, our rate pages show the trade-off in concrete current terms.
When a Cap-Based Strategy Fits — and When It May Not
Cap-based strategies tend to fit best when you want a crediting structure that is easy to understand and maintain over a long holding period. The trade-off is explicit: you participate in index gains up to the cap, and you avoid principal losses when the index declines. That clarity reduces decision fatigue during market volatility and helps investors stay committed to the strategy through the market environments where abandoning the plan is most costly. Cap-based FIAs are often considered by pre-retirees and retirees who want to reduce exposure to market drawdowns as they approach or enter retirement — the period when sequence-of-returns risk is most dangerous and when a large portfolio decline is hardest to recover from. In that context, a cap-based FIA can function as a stability component within a broader retirement strategy — an asset that can grow in positive markets, protect in negative ones, and later support income planning depending on the contract structure.
Liquidity matters significantly in this evaluation. If you expect to take large withdrawals early in the contract, the annuity surrender schedule and free withdrawal provisions may drive the selection decision more than the cap level. Most FIAs allow penalty-free withdrawals up to a stated percentage of the account value annually — commonly 10% — but larger withdrawals during the surrender period trigger charges that can offset the growth benefit. Understanding how liquidity provisions interact with the cap structure ensures the product works in real life, not just in an illustration.
A cap strategy may not be the best fit if the primary goal is maximizing upside and you are comfortable with full market risk — in that scenario, direct market investments or a variable annuity may better match the objective. Cap strategies may also feel limiting for investors who strongly prefer participation-only or spread-based approaches. And for investors whose primary objective is guaranteed lifetime income starting now or soon, the cap rate may be less relevant than rider payout factors and income base mechanics — as explained in detail in our resource on what a GLWB is and how a GLWB works. For broader comparisons across annuity structures and the trade-offs between them, our resource on bonus annuity pros and cons provides a useful alternative-strategy lens.
Get a Personalized FIA Strategy Comparison (Cap vs. Participation vs. Spread)
We’ll compare strategies on the same index and term, explain renewal cap discretion, and highlight which contracts fit your timeline and liquidity needs.
Cap Rates, Income Riders, and Real-World Outcomes
Cap comparisons become more complex when a product includes optional income riders — particularly lifetime income riders. Riders create real planning value in the right context, but rider charges are typically deducted annually from the account value, which reduces net accumulation. A strategy might show a high cap, but the net effect after rider fees can be lower than expected depending on how the rider is structured and how long the accumulation phase runs before income begins.
This is also where separating account value from income base is critical. If an income rider is elected, the contract typically tracks two separate values: the account value (actual cash value) and the income benefit base (the value used to calculate guaranteed withdrawals). These are not the same. The income base may grow at a guaranteed roll-up rate that is different from what the underlying cap strategy produces. Understanding what a GLWB is and how these parallel tracking systems work is essential for reading illustrations correctly and knowing whether the cap rate or the rider mechanics are the primary driver of the outcome for your specific plan. If accumulation is the primary goal, the cap, participation, and spread mechanics usually drive the analysis. If guaranteed lifetime income is the primary goal, rider payout factors and the rules governing when and how income activates matter more than the cap. The best comparisons align the product’s design with the planning purpose before comparing caps across carriers. For help determining how much income you need in retirement, our resource on retirement income planning provides the framework for that conversation before product selection begins.
How to Compare Cap Rates Correctly
Cap comparisons are most useful when the comparison is structured fairly. Compare strategies with the same crediting method and term length where possible — a one-year point-to-point cap is not directly comparable to a two-year point-to-point cap, and neither is directly comparable to a monthly sum with a monthly cap. If comparing across methods, do it intentionally and understand why the behavior differs in different market environments. A higher cap on a one method may produce lower credited interest than a lower cap on another method in the same market environment, depending on the index and how gain is measured.
The index being referenced matters equally. Different indices behave differently, and many indexed annuity strategies use volatility-controlled indices that are designed to reduce volatility relative to a standard price-return index. A higher cap on a volatility-controlled index may not produce higher credited interest than a lower cap on the S&P 500 price-return index in the same year, because the starting index levels and measurement methodology are different. Comparing the full strategy — index, cap, term, and crediting method — rather than the cap number in isolation is the only way to produce a meaningful side-by-side comparison. Our resource on today’s best annuity rates provides a current-market reference point for understanding where caps sit relative to the broader competitive landscape.
Compare Today’s Best Annuity Rates
Review competitive fixed, indexed, and income-focused annuity options from top carriers. Cap rates are one piece of the puzzle, but the best fit depends on crediting terms, renewal minimums, liquidity rules, and whether the annuity is primarily for growth, income, or both.
Top Fixed Annuity Rates
Top Bonus Annuity Rates
Request a Personalized Quote
Why Cap Rates Deserve a Second Look Before You Choose a Strategy
Cap rates matter because they influence what the annuity can realistically earn in strong years, and those strong years often drive a meaningful portion of long-term growth. But a cap is not just a limiter — it is a pricing signal. A cap that is slightly lower but paired with stronger renewal minimums, better liquidity features, and a cleaner contract design may be the superior long-term choice compared to a strategy that looks attractive today but has weaker minimum guarantees or unfavorable renewal discretion. This is why thinking in terms of strategy fit rather than cap shopping produces better outcomes. If your priority is principal protection with reasonable upside, cap-based strategies can be excellent. If your priority is maximum upside and you have genuine risk tolerance, a direct market approach may match your expectations better than any indexed annuity. If your priority is guaranteed income now, rider design and payout factors likely matter more than the cap level. The key is choosing a contract built for your actual goal.
While cap rates are specific to fixed indexed annuities, the planning problem behind them is broader: how do you create dependable resources for a long retirement without taking risk you cannot afford? This is also where life insurance planning overlaps with annuity planning more than many people expect. Life insurance can protect income during working years, replace lost income for a surviving spouse, and provide a tax-advantaged legacy. In retirement planning, some families use annuities to create a lifetime paycheck and use life insurance to preserve or restore legacy value that might otherwise be reduced as annuity income is paid over time. The integrated evaluation — how each tool solves a specific problem in the plan — is the core of what we do at Diversified Insurance Brokers, and it is why the best clients stop chasing the highest cap and start building the best plan. For a complete view of what to expect from the FIA landscape across product types, our annuity overview and our resource on fixed indexed and income annuity rates provide the starting points for that broader comparison.
Related Pages
Indexed Annuity Mechanics & Rate Comparisons
Use these to go deeper on the mechanics that interact with cap rates — and to compare cap-based strategies against other annuity structures.
Talk With an Advisor Today
Choose how you’d like to connect—call or message us, then book a time that works for you.
Schedule here:
calendly.com/jason-dibcompanies/diversified-quotes
Licensed in all 50 states • Fiduciary, family-owned since 1980
FAQs: What Is an Annuity Cap Rate?
What is an annuity cap rate and how does it affect my credited interest?
An annuity cap rate is the maximum interest a fixed indexed annuity can credit during a specific crediting period, regardless of how strongly the underlying market index performs. If the contract has an 8% annual cap and the index rises 12%, you receive 8% — the cap absorbs the difference. If the index rises 5%, you receive 5% because the gain falls below the cap. If the index is negative, you typically receive 0% and the principal is protected from market loss. The cap rate is the mechanism that makes principal protection affordable — the insurer’s ability to guarantee that a negative index year doesn’t reduce the account value comes from investing premium in the general account and using the spread to fund index options. The cap is the ceiling that reflects what that hedging budget can support at current market conditions. Understanding how annuities earn interest in full explains the mechanics behind why caps are priced the way they are and what drives them higher or lower over time.
What is the difference between a cap rate, a participation rate, and a spread?
These are three different mechanisms for translating positive index performance into credited interest. A cap rate sets a ceiling — if the index gains more than the cap, you receive the cap; if it gains less, you receive the actual gain. A participation rate credits a defined percentage of the index gain with no hard ceiling — if participation is 80% and the index gains 10%, you receive 8%. A spread subtracts a fixed percentage from the index gain before crediting — if the spread is 2% and the index gains 10%, you receive 8%; if the index gains 1.5% and the spread is 2%, you receive 0%. Each mechanism produces different results in the same market environment, which is why comparing strategies requires modeling multiple return scenarios rather than relying on any single year’s outcome. Some FIA strategies combine these mechanisms — for example, participation rate with a cap — which adds another layer to evaluate. The complete strategy structure, not any single lever number, is what determines real-world credited interest over a multi-year holding period.
Can the cap rate change after I purchase the annuity?
Yes — in most fixed indexed annuities, cap rates are renewable at the end of each crediting term, typically annually. The carrier has discretion to adjust the cap at each renewal based on prevailing interest rates, hedging costs, and competitive conditions, subject to any minimum guaranteed cap stated in the contract. This means the cap you receive at purchase may not be the cap that applies in later contract years. Two products can look similar today but behave very differently over a 10-year holding period if one has a meaningful minimum guaranteed cap and the other does not. When evaluating a cap-based strategy, always ask three questions: What is the current cap? How often can it change? What is the minimum guaranteed cap, if any? For contracts that include a minimum guaranteed rate structure, that floor provides a contractual protection against the cap declining below a defined level — which is a meaningful planning consideration when comparing products with similar current caps but different contract minimums.
Why do some FIAs have a higher cap than others?
Cap rate differences between carriers reflect differences in hedging budgets, general account yields, index choices, product design, and carrier-specific risk management. In general terms, higher interest rate environments support higher caps because general account yields generate a larger budget for the index options that create upside potential. Higher market volatility increases option costs, which can pressure caps lower. Carriers that use volatility-controlled proprietary indices — which are designed to limit volatility below that of a standard price-return index — can sometimes offer higher participation rates or more competitive cap structures on those indices compared to what they offer on the S&P 500 price-return index. That is why a direct cap-to-cap comparison across carriers is only meaningful when the underlying index and crediting method are the same. A higher cap on a volatility-controlled index does not automatically produce more credited interest than a lower cap on the S&P 500 in the same year, because the starting index behavior is different. Our resource on today’s best annuity rates provides a current-market reference for comparing competitive cap environments across the major FIA carriers.
Is a cap-based FIA appropriate if I want guaranteed lifetime income?
A cap-based FIA can support guaranteed lifetime income goals when it includes a GLWB income rider, but the cap rate itself is not the primary driver of the income outcome in that scenario. When an income rider is elected, the contract tracks two separate values: the account value (actual cash value driven by cap-based index crediting) and the income benefit base (the value used to calculate guaranteed withdrawals, which grows at a guaranteed roll-up rate defined in the rider). These are not the same, and in an income-focused evaluation, the rider’s roll-up rate and payout factors typically matter more than the cap rate for determining how much guaranteed income the contract will produce. Understanding what a GLWB is and how it works mechanically is the essential foundation for reading income illustrations correctly and knowing which elements of the contract are driving the income projection. If accumulation is the primary goal, cap mechanics dominate the analysis. If income is the primary goal, rider design should lead the comparison — with the cap rate evaluated as a secondary factor affecting the account value trajectory during the deferral period.
About the Author:
Jason Stolz, CLTC, CRPC, DIA, CAA and Chief Underwriter at Diversified Insurance Brokers (NPN 20471358), is a senior insurance and retirement professional with more than 25 years of real-world experience helping individuals, families, and business owners protect their income, assets, and long-term financial stability. As a long-time partner of the nationally licensed independent agency Diversified Insurance Brokers, Jason provides trusted guidance across multiple specialties—including fixed and indexed annuities, long-term care planning, personal and business disability insurance, life insurance solutions, Group Health, Travel Medical and Evacuation Insurance, and short-term health coverage. Diversified Insurance Brokers maintains active contracts with over 100 highly rated insurance carriers, ensuring clients have access to a broad and competitive marketplace.
His practical, education-first approach has earned recognition in publications such as VoyageATL, and contributions from his agency featured in Kiplinger and GoBankingRates— highlighting his commitment to financial clarity and client-focused planning. Drawing on deep product knowledge and years of hands-on field experience, Jason helps clients evaluate carriers, compare strategies, and build retirement and protection plans that are both secure and cost-efficient. Visitors who want to explore current annuity rates and compare options across multiple insurers can also use this annuity quote and comparison tool.
Explore More Annuity Options: Browse our complete guide to Common Annuity Myths — covering annuity mechanics, rules, fees, riders, cap rates & participation rates explained from 100+ carriers.
Last Reviewed: June 20, 2026 |
Reviewed by: Jason Stolz, CLTC, CRPC, DIA, CAA
Chief Underwriter, Diversified Insurance Brokers, Inc. | NPN: 20471358 | Diversified Insurance Brokers, Inc. — Licensed in all 50 states
Fact Checked by: Tonia Pettitt, CMIP©
Medicare Specialist, Diversified Insurance Brokers, Inc. | NPN: 14374308 | Diversified Insurance Brokers, Inc. — Licensed in all 50 states
Did you find this content helpful? Leave us a Google review — it helps others find trustworthy guidance too.
Editorial Standards: Diversified Insurance Brokers maintains rigorous editorial standards to ensure accuracy, clarity, and independence in all content. Learn more about our editorial standards and commitment to transparency.
