
What is a Fixed Indexed Annuity Annual Point-to-Point
As an Independent Annuity Broker, we compare rates across 100+ carriers and 1,000 different annuities— not just one company’s product offerings — to find the best fit for your goals.
What is a Fixed Indexed Annuity Annual Point-to-Point

Jason Stolz CLTC, CRPC, DIA, CAA
If you’ve ever seen “fixed indexed annuity” and wondered what the actual mechanism is underneath the marketing language, annual point-to-point is almost certainly what you’re picturing, whether you knew the name or not. It’s the original, most common, and most straightforward version of index-linked crediting: the insurer looks at where a market index stood on the day your contract started, looks again a year later, and credits you a share of the gain, up to a limit, with your principal fully protected if the index fell instead. Every other crediting method covered elsewhere on this site, monthly averaging, multi-year terms, performance triggers, exists as a variation on, or an alternative to, this same basic idea.
Jason Stolz, CLTC, CRPC, DIA, CAA, is Chief Underwriter at Diversified Insurance Brokers and has explained this exact mechanism to clients more times than any other crediting concept, precisely because it’s the default most FIA contracts lead with. As an independent annuity broker working across the full carrier landscape, our office can show you honestly what this strategy has actually delivered historically, what it quietly leaves on the table compared to owning the index directly, and where it genuinely earns its reputation as the sensible default.
New to fixed indexed annuities and want the real mechanics explained plainly? Let’s walk through it.
Talk to an Annuity Specialist
| Index Performance for the Year | What Gets Credited (9% Cap) | Why |
|---|---|---|
| Up 24% (a strong bull year) | 9% credited | The cap limits your share — you never receive the full index gain in a strong year |
| Up 7% (a modest gain) | 7% credited | Below the cap, so you receive the index’s full gain that year |
| Flat (0%) | 0% credited | No gain occurred, so there’s nothing to share |
| Down 12% | 0% credited — not −12% | The floor absorbs the loss entirely; your account value doesn’t move |
| Down 38% (a crash year, e.g. 2008) | 0% credited — not −38% | Same floor protection applies regardless of how severe the decline is |
The 9% cap above is illustrative only and doesn’t represent any specific product or currently offered rate.
Notice what the table actually shows: the cap works against you in strong years and does nothing at all in weak ones, while the floor works for you in weak years and does nothing in strong ones. Neither one is free — the cap is the price of the floor. An insurer that guarantees you’ll never see a repeat of that final row has to fund that guarantee somehow, and limiting your upside in the good years is how. There’s a second, less visible cost as well, which we’ll get to next: even in a year the cap doesn’t touch, the index level itself isn’t measuring quite what you might assume it is.
That roughly two-percentage-point annual gap is real, it’s structural, and it applies to every S&P 500-linked strategy on this list, not just annual point-to-point specifically. It’s worth understanding clearly before comparing an FIA’s headline numbers against what you’ve read about “the market” returning over the same period, and we’ll come back to exactly why it exists further down this page.
Ensure you are receiving the absolute top rates
Current Fixed Annuity Rates
Compare today’s best fixed annuity rates from top carriers.
Current Bonus Annuity Rates
See which annuities offer the highest upfront bonus today.
Request an Annuity Quote
Submit our annuity request form to get personalized rate options.
Lifetime Income Calculator
Use our calculator to see how much guaranteed income your annuity can provide.
The Mechanic, Plainly
On the day your contract begins, or on each contract anniversary after that, the insurer records the index’s value. One year later, it records the value again. It subtracts the first number from the second to find the percentage change. If the index rose, you’re credited a share of that gain, determined by your contract’s cap, participation rate, or spread, whichever formula the specific strategy uses. If the index fell, you’re credited nothing for that year, but nothing is taken away either; your account value simply stays where it was. Then the whole process resets, using the current index value as the new starting point for the next year.
That’s the entire mechanism. No averaging, no monthly snapshots, no multi-year waiting period. Just two dates, one comparison, once a year.
Why This Is the Default Most People Start With
Annual point-to-point earned its position as the most common crediting choice for reasons that hold up under scrutiny, not just because it’s the oldest or the easiest to explain. Historically, in most market environments, it has outperformed monthly sum, since monthly caps meaningfully limit gains in any single strong month, while annual point-to-point only cares about the net result across the full year. It’s also simpler to track and verify than an averaging method, since there’s exactly one number to check at the end of the year rather than twelve. For a buyer who wants a genuinely easy-to-understand strategy with a solid historical track record, this is why advisors so often point here first.
What the Zero Floor Has Actually Been Worth
The value of principal protection is easy to state abstractly and much more convincing with real history behind it. In 2008, the S&P 500 fell by roughly 38%. In 2022, it fell by roughly 19%. An annual point-to-point contract linked to the S&P 500 credited 0% in both of those years, not a loss. Over a full market cycle that includes both strong years and years like those, the zero floor is doing real, quantifiable work, and it’s a meaningful part of why this strategy has a place in a retirement plan for someone who genuinely cannot afford a repeat of either year happening to their principal.
The Trade-Off Nobody Puts on the Brochure Cover
Here’s the honest counterpart to that floor. Fixed indexed annuities linked to the S&P 500 almost universally track the index’s price-only value, not its total return, which means dividends paid by the 500 underlying companies are excluded from the calculation entirely. This isn’t a minor technicality; dividends have historically contributed somewhere in the range of one and a half to two percentage points to the S&P 500’s annual total return, and the table above shows what that gap actually looked like over one real 20-year stretch. The reason is structural rather than arbitrary: carriers fund the crediting promise by purchasing options tied to the price-only version of the index, and including dividends in that calculation would require meaningfully more expensive options, leaving less budget for the guarantees and rates the contract is built around. Our dedicated explanation of how the S&P 500 functions as an index inside an annuity covers this mechanism in full, and it’s worth reading before assuming an FIA’s index performance will track what you see reported in the news.
The other honest trade-off is timing. Because annual point-to-point depends entirely on two single dates, wherever the index happens to sit on your specific contract anniversary is what determines your entire year’s result, regardless of how strong the market was at any other point during those twelve months. A rally that peaked in October and gave back half its gains by your anniversary in December credits based on wherever things stood on that anniversary, not the October peak. This is precisely the risk that monthly and daily averaging strategies were built to address, at the cost of discounting a genuinely strong, steady year in exchange for that protection.
Want an honest look at what annual point-to-point has actually delivered against real historical data?
Ask for a Real Comparison
Where Annual Point-to-Point Sits Among the Full Menu
Every other crediting approach on a fixed indexed annuity is best understood as a deliberate variation on this baseline, built to solve a specific problem annual point-to-point doesn’t address. If the single-measurement-date risk concerns you, monthly averaging and daily averaging replace that single ending reading with many, at the cost of discounting a steady climb. If you want a genuinely different formula rather than a smoother measurement, a performance trigger pays a fixed rate for any positive year regardless of magnitude, and its counterpart, the inverse trigger, does the reverse. If you’re drawn to a longer measurement window in exchange for a potentially stronger rate, two-year and multi-year point-to-point stretch the same basic mechanic across a longer term. And the monthly sum method takes an entirely different approach, capping gains monthly while letting losses pass through uncapped. Our broader overview of indexed annuity crediting methods ties this whole menu together in one place, and understanding annual point-to-point first is what makes every one of those alternatives make sense as a genuine trade-off rather than an arbitrary choice.
The Formula That Gets Applied
Annual point-to-point doesn’t specify how much of the gain you keep on its own, that’s determined by which formula governs the strategy. Our overviews of cap rates, participation rates, and spread rates cover the three most common mechanisms in depth. Any of the three can be paired with annual point-to-point, and the right choice among them depends heavily on your outlook for how strongly the index is likely to move in a given year.
Who Genuinely Fits This Strategy
A buyer who wants the simplest, most transparent, most historically-tested version of index-linked crediting, and who’s comfortable accepting that a single measurement date governs the entire year’s result, is the clearest fit for annual point-to-point. It’s a reasonable default for someone just beginning to evaluate fixed indexed annuities, since understanding it thoroughly makes every other strategy on this page easier to evaluate by comparison. It fits less well for a buyer specifically worried about a bad measurement date undoing an otherwise strong year, for whom an averaging-based method may be worth the trade-off in exchange for that protection.
How We Help
We start most fixed indexed annuity conversations here, because understanding this baseline mechanic honestly, including what it costs you in excluded dividends and single-date timing risk, is what makes every other crediting option on the menu make sense as a genuine choice rather than jargon on a brochure. If annual point-to-point is the right fit for your goals, we’ll help you compare cap, participation, and spread structures across carriers. If a different strategy fits better, we’ll show you exactly what you’d be trading to get there.
Our broader guidance on choosing the right annuity and genuine annuity suitability reflects the same grounding we bring to this page. If you already hold an annual point-to-point contract and want an honest read on whether its cap or participation rate is still competitive, our second-opinion review is built for exactly that question, and if the answer points toward a different contract entirely, our guide on replacing an annuity the right way walks through what that would actually involve.
Ready to understand exactly what you’d be getting with an annual point-to-point strategy?
Get Your Annuity Reviewed
Financial Protection Essentials
Explore retirement distribution rules, carrier strength, and long-term care planning.
Explore Every Crediting Strategy
Measurement Period — How Long Before Interest Is Calculated
Crediting Method — How the Index Is Measured
Rate Formula — How Much of the Gain You Keep
See the Full Menu Overview →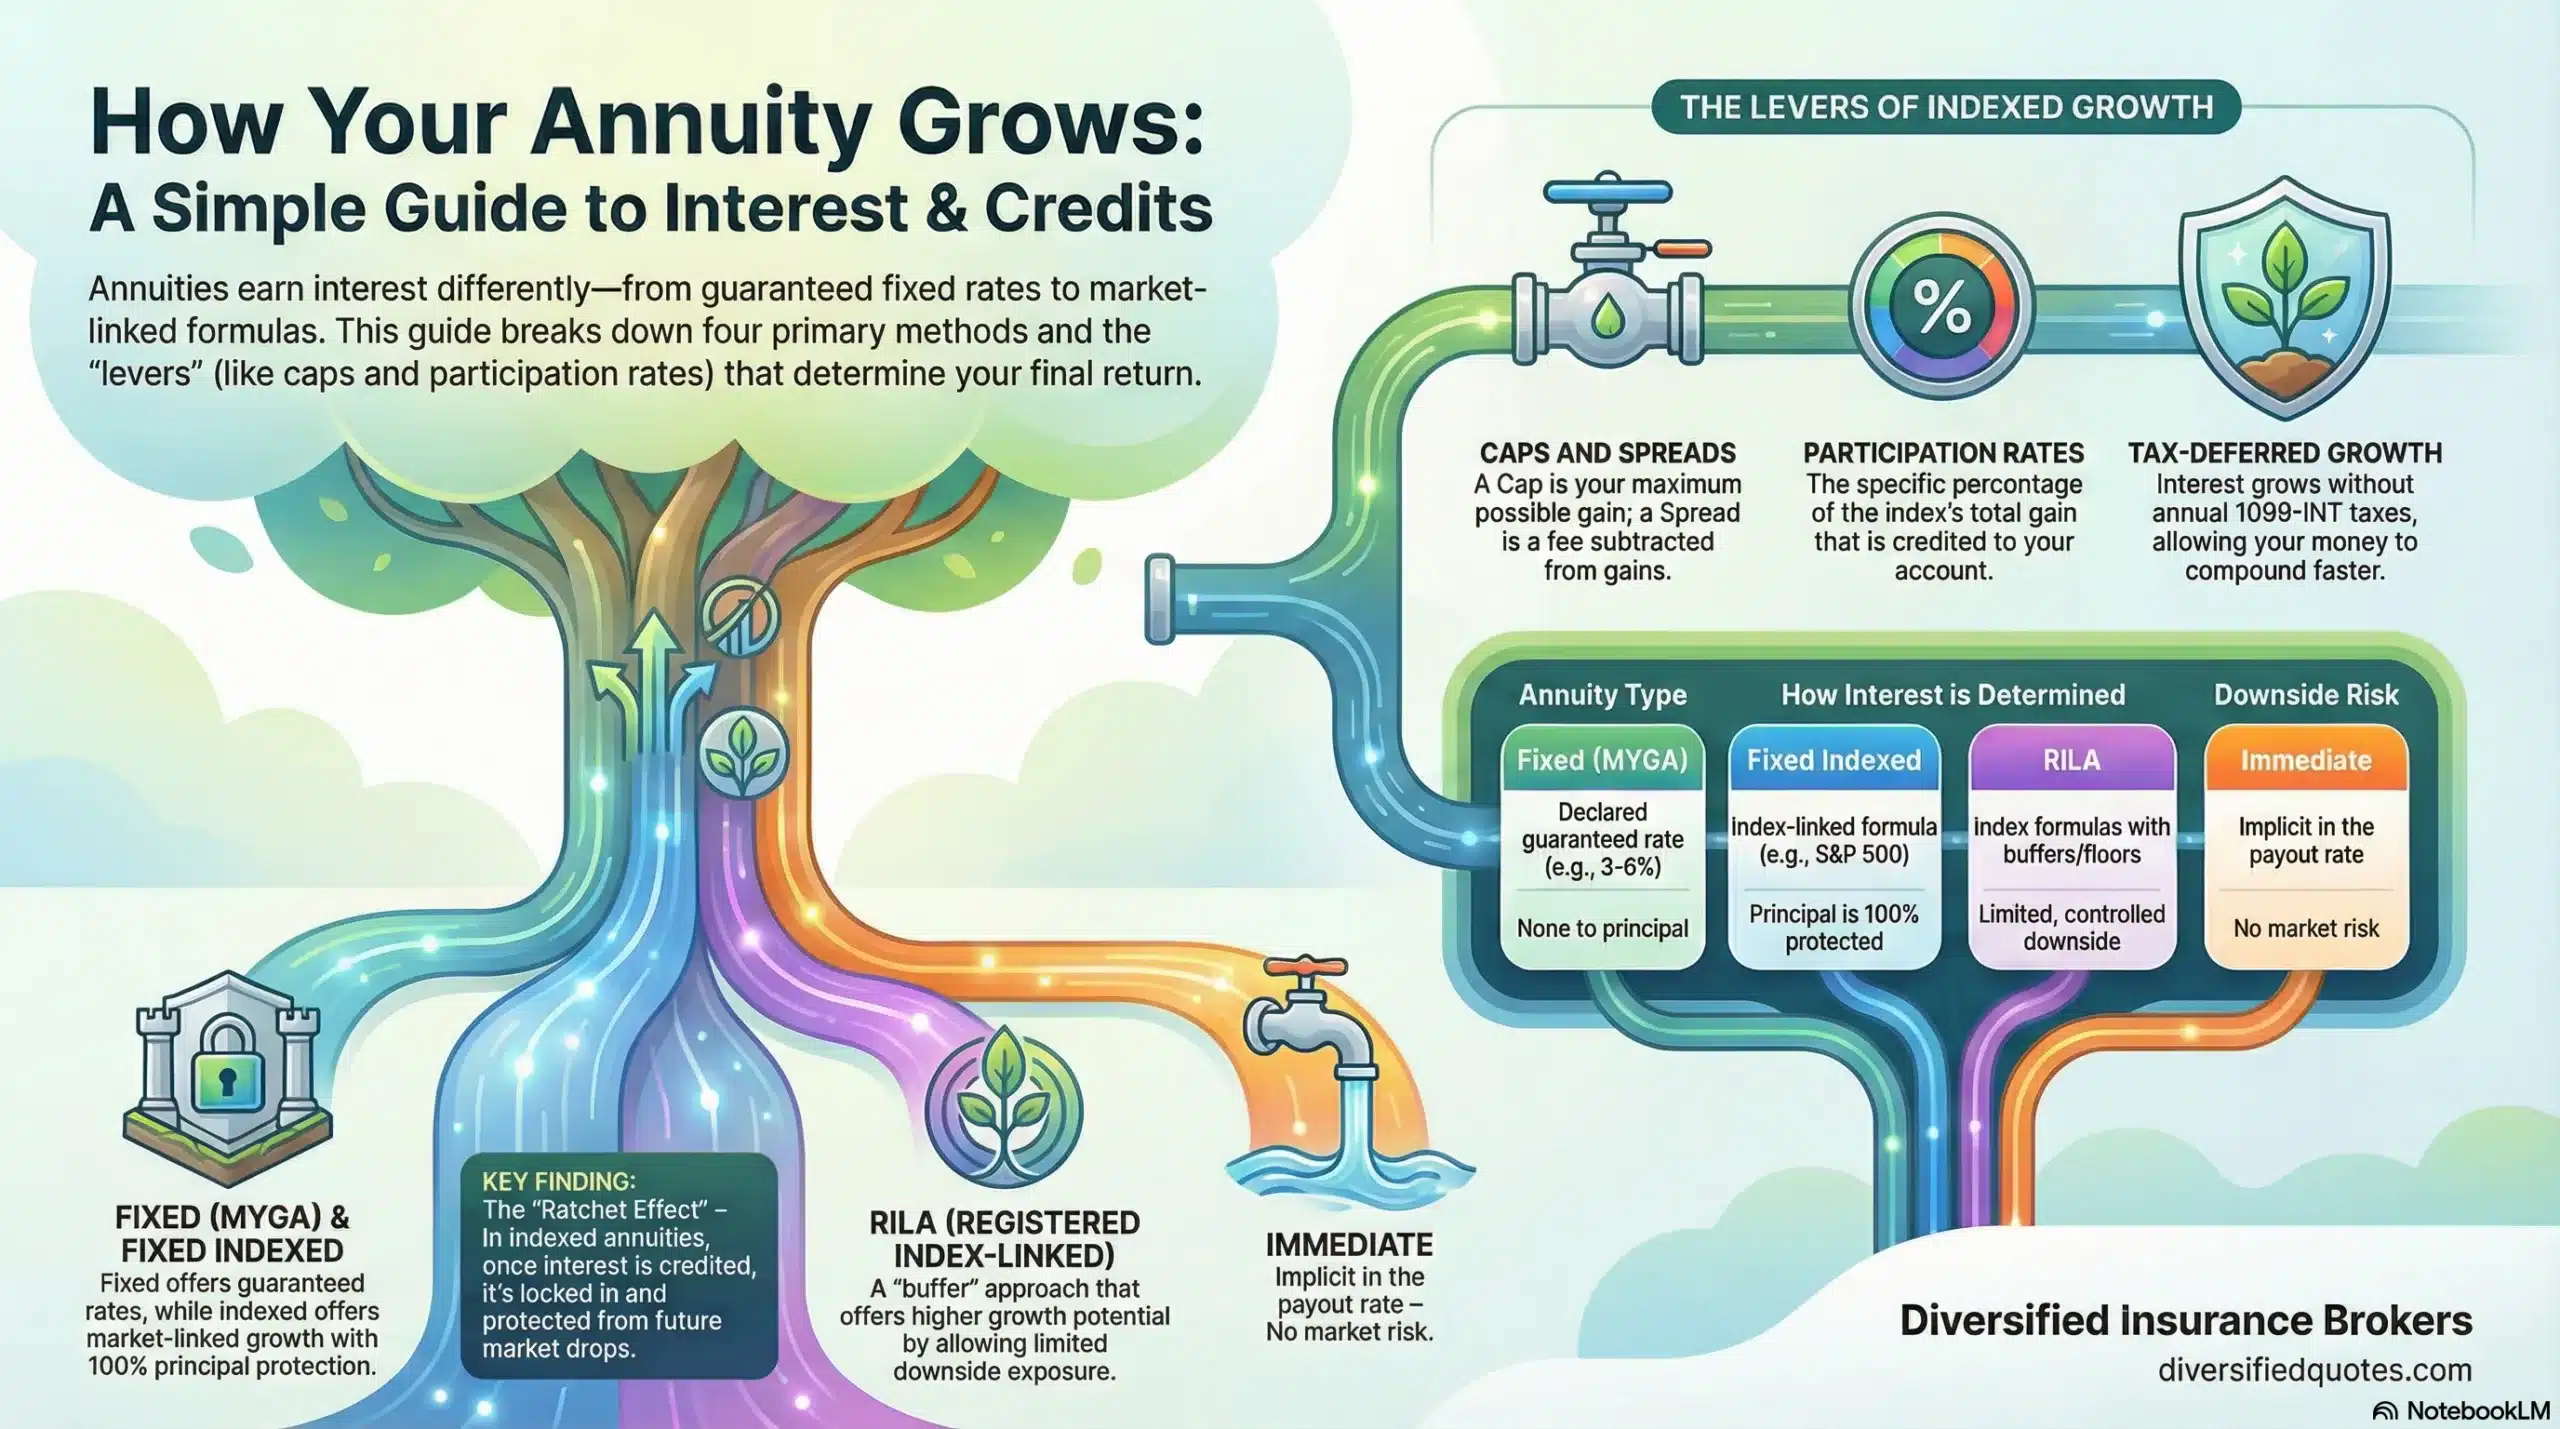
Talk With an Advisor Today
Choose how you’d like to connect—call or message us, then book a time that works for you.
Schedule here:
calendly.com/jason-dibcompanies/diversified-quotes
Licensed in all 50 states • Fiduciary, family-owned since 1980
What is annual point-to-point in a fixed indexed annuity?
It’s the most common indexed crediting method: the insurer records the index’s value on the day your contract begins, records it again one year later, and credits you a share of any gain, determined by your contract’s cap, participation rate, or spread. If the index fell, you’re credited nothing for that year, but nothing is taken away either. Then the process resets, using the current index value as the new starting point for the next year. It’s the simplest, most historically tested version of index-linked crediting, and every other strategy is best understood as a variation built to address something this baseline method doesn’t.
Does an annual point-to-point FIA include dividends from the S&P 500?
No. Fixed indexed annuities linked to the S&P 500 almost universally track the index’s price-only value, excluding dividends paid by the 500 underlying companies entirely. Dividends have historically contributed roughly one and a half to two percentage points to the S&P 500’s annual total return, a real and structural gap, not a minor technicality. Over the 20 years ending December 2024, the price-only S&P 500 returned about 8.22% annually compared to 10.35% including dividends, according to Fidelity Investments. This applies to every S&P 500-linked crediting strategy, not just annual point-to-point specifically.
Why are dividends excluded from FIA crediting calculations?
It’s structural rather than arbitrary. Carriers fund the interest-crediting promise by purchasing options tied to the price-only version of the index, using a portion of the yield from the fixed-income investments backing your premium. Including dividends in that calculation would require meaningfully more expensive options, leaving less budget available for the guaranteed minimum rates, the carrier’s operating costs, and the principal protection the contract is built around. This is why the price-only index, not the total return version, is the near-universal standard for FIA crediting.
Has the zero floor on annual point-to-point actually mattered historically?
Yes, and concretely so. In 2008, the S&P 500 fell by roughly 38%. In 2022, it fell by roughly 19%. An annual point-to-point contract linked to the S&P 500 credited 0% in both of those years, not a loss. Over a full market cycle that includes both strong years and years like those, the zero floor is doing real, quantifiable work, and it’s a meaningful part of why this strategy remains a reasonable choice for someone who genuinely cannot afford a repeat of either year happening to their principal.
What’s the main risk of annual point-to-point compared to other crediting methods?
Its dependence on a single measurement date. Because the calculation only compares two specific dates, wherever the index happens to sit on your contract anniversary determines your entire year’s result, regardless of how strong the market was at any other point during those twelve months. A rally that peaked mid-year and gave back gains by your anniversary credits based on wherever things stood on that anniversary, not the earlier peak. This is precisely the risk that monthly and daily averaging strategies were built to address, at the cost of discounting a genuinely strong, steady year in exchange for that protection.
Why is annual point-to-point the most commonly recommended crediting method?
Because it holds up well on both simplicity and historical performance. In most historical market environments, it has outperformed monthly sum, since monthly caps meaningfully limit gains in any single strong month while annual point-to-point only cares about the net result across the full year. It’s also easier to track and verify than an averaging method, since there’s exactly one number to check at the end of the year rather than twelve. For a buyer who wants an easy-to-understand strategy with a solid track record, this combination is why it’s so often the starting recommendation.
Who is annual point-to-point actually right for?
A buyer who wants the simplest, most transparent, most historically tested version of index-linked crediting, and who’s comfortable accepting that a single measurement date governs the entire year’s result, is the clearest fit. It’s a reasonable default for someone just beginning to evaluate fixed indexed annuities, since understanding it thoroughly makes every other strategy easier to evaluate by comparison. It fits less well for a buyer specifically worried about a bad measurement date undoing an otherwise strong year, for whom an averaging-based method may be worth the trade-off.
About the Author:
Jason Stolz, CLTC, CRPC, DIA, CAA and Chief Underwriter at Diversified Insurance Brokers (NPN 20471358), is a senior insurance and retirement professional with more than 25 years of real-world experience helping individuals, families, and business owners protect their income, assets, and long-term financial stability. As a long-time partner of the nationally licensed independent agency Diversified Insurance Brokers, Jason provides trusted guidance across multiple specialties—including fixed and indexed annuities, long-term care planning, personal and business disability insurance, life insurance solutions, Group Health, Travel Medical and Evacuation Insurance, and short-term health coverage. Diversified Insurance Brokers maintains active contracts with over 100 highly rated insurance carriers, ensuring clients have access to a broad and competitive marketplace.
His practical, education-first approach has earned recognition in publications such as VoyageATL, and contributions from his agency featured in Kiplinger and GoBankingRates— highlighting his commitment to financial clarity and client-focused planning. Drawing on deep product knowledge and years of hands-on field experience, Jason helps clients evaluate carriers, compare strategies, and build retirement and protection plans that are both secure and cost-efficient. Visitors who want to explore current annuity rates and compare options across multiple insurers can also use this annuity quote and comparison tool.
Explore More Annuity Options: Browse our complete guide to What Is a Fixed Indexed Annuity? — covering FIA education, mechanics, crediting methods & indexed annuity strategies from 100+ carriers.
Last Reviewed: August 30, 2026 |
Reviewed by: Jason Stolz, CLTC, CRPC, DIA, CAA
Chief Underwriter, Diversified Insurance Brokers, Inc. | NPN: 20471358 | Diversified Insurance Brokers, Inc. — Licensed in all 50 states
Fact Checked by: Tonia Pettitt, CMIP©
Medicare Specialist, Diversified Insurance Brokers, Inc. | NPN: 14374308 | Diversified Insurance Brokers, Inc. — Licensed in all 50 states
Did you find this content helpful? Leave us a Google review — it helps others find trustworthy guidance too.
Editorial Standards: Diversified Insurance Brokers maintains rigorous editorial standards to ensure accuracy, clarity, and independence in all content. Learn more about our editorial standards and commitment to transparency.
