
How to get the Best Annuity Rates
As an Independent Annuity Broker, we compare rates across 100+ carriers and 1,000 different annuities— not just one company’s product offerings — to find the best fit for your goals.
How to get the Best Annuity Rates

Jason Stolz CLTC, CRPC, DIA, CAA
Annuity rates are not standardized. Two people with identical ages, identical premium amounts, and identical product types who purchase from different carriers on the same day can end up with meaningfully different guaranteed returns — sometimes by a full percentage point or more. Over the life of a ten-year annuity contract funded with $200,000, a one-percent rate difference translates to approximately $20,000 or more in additional credited interest. That is not a rounding error. It is the direct result of whether the buyer compared rates across the marketplace or accepted the first offer presented to them. Understanding how to get the best annuity rates is therefore not merely academic — it is a concrete, actionable financial discipline that directly determines the lifetime income, accumulated value, or guaranteed payout a retiree ultimately receives. At Diversified Insurance Brokers, Jason Stolz, CLTC, CRPC, DIA, CAA, works with retirees and pre-retirees across all fifty states to identify current annuity rates from more than 100 carriers and build strategies that align with each client’s income timeline, risk tolerance, and retirement goals.
The annuity market rewards comparison. Unlike bank CDs, where FDIC insurance creates a uniform safety floor and the only variable is the rate itself, annuities involve contract-specific terms — surrender schedules, crediting methods, rider costs, free withdrawal provisions, and renewal rate history — that interact with the stated rate to determine actual long-term outcomes. Knowing what today’s best annuity rates are is only the starting point. Knowing how to evaluate those rates in context — against the carrier’s financial strength, the contract’s flexibility provisions, and your own income timeline — is what separates a well-structured annuity from one that simply advertises the highest number. This guide covers both dimensions.
Compare Annuity Rates Across 100+ Carriers
One quote from one company is never the full picture. Let us show you what the full market looks like for your age, premium, and goals.
Request Your Annuity Rate ComparisonEnsure you are receiving the absolute top rates
Current Fixed Annuity Rates
Compare today’s best fixed annuity rates from top carriers.
Current Bonus Annuity Rates
See which annuities offer the highest upfront bonus today.
Request an Annuity Quote
Submit our annuity request form to get personalized rate options.
Lifetime Income Calculator
Use our calculator to see how much guaranteed income your annuity can provide.
How Annuity Rates Are Determined
Insurance companies set annuity crediting rates primarily based on what they earn investing the premiums they collect. When a buyer purchases an annuity, the insurer places the premium into its general account investment portfolio — predominantly long-duration bonds, corporate debt, and other fixed-income instruments. The net yield generated by that portfolio, after expenses and profit margin, determines what the insurer can afford to credit to policyholders. This is why the broader interest rate environment is the dominant external driver of annuity rates: when the Federal Reserve raises benchmark rates, bond yields rise, insurers earn more on new investments, and annuity crediting rates can increase correspondingly. When rates fall, the reverse applies.
However, the relationship between market interest rates and annuity crediting rates is not mechanical or uniform across carriers. Each insurer has its own investment portfolio composition, duration strategy, expense structure, competitive positioning, and pricing philosophy. A carrier that took on longer-duration bonds during a prior period of higher rates may be able to sustain above-market crediting rates even after benchmark rates decline, because its portfolio is still earning higher yields on those locked-in assets. Conversely, a carrier that invested conservatively may lag on rate competitiveness even in a favorable rate environment. These differences mean that the spread between the highest and lowest rates available on an otherwise identical product type can be substantial at any given moment. Understanding how annuity income is calculated and what drives the underlying crediting mechanics helps buyers evaluate rate offers more critically rather than simply accepting headline numbers at face value.
Annuity Rate Comparison by Product Type
| Annuity Type | How Rate Is Expressed | Rate Guaranteed? | Key Rate Variable to Compare | Best For |
|---|---|---|---|---|
| Multi-Year Guaranteed Annuity (MYGA) | Fixed % per year for stated term | Yes — contractually locked | Annual crediting rate and term length | Predictable growth; CD alternative |
| Fixed Indexed Annuity (FIA) | Cap rate, participation rate, or spread rate | Floor is guaranteed; upside varies | Cap rate, participation rate by index design | Growth potential with principal protection |
| FIA with Income Rider (GLWB) | Roll-up rate on income benefit base | Roll-up guaranteed; payout rate varies | Roll-up rate, payout %, rider fee | Guaranteed lifetime income; pension replacement |
| Single Premium Immediate Annuity (SPIA) | Monthly payout per $1,000 of premium | Yes — payment is fixed for life | Monthly income per dollar invested | Immediate income; highest payout per dollar |
| Bonus Annuity (FIA with premium bonus) | Bonus % added to premium at issue | Bonus guaranteed; vesting schedule applies | Bonus %, vesting schedule, cap rates | Rollover acceleration; income base growth |
The Independent Broker Advantage in Rate Shopping
The single most consequential decision in the annuity shopping process is not which carrier to choose — it is whether you shop across the market at all. A captive agent who represents one insurance company can only show you that company’s products and rates, regardless of how competitive or uncompetitive those offerings are on a given day. A bank or brokerage firm that offers a proprietary annuity shelf presents a curated subset of the market, often weighted toward products that carry higher compensation or preferred distribution agreements. Neither channel gives you access to the full rate environment. An independent annuity broker who contracts with 100 or more carriers has something fundamentally different to offer: the ability to run a true cross-carrier comparison on the day you are ready to buy, pulling actual current rates from across the market simultaneously.
The structural reason independent brokers often surface better rates is straightforward. Carriers that sell exclusively through independent distribution channels spend less on captive sales forces, branch office infrastructure, and proprietary marketing budgets. Those cost savings can flow through to policyholders as higher crediting rates. As one industry analysis notes, carriers who sell primarily through independent brokers pay less in acquisition costs than carriers with massive captive sales forces, and those savings often appear as higher rates for buyers. This is not a universal rule — some of the strongest-rated carriers command premium distribution but also deliver premium contract terms — but it helps explain why a diligent rate comparison through an independent channel consistently surfaces options that bank- or captive-only channels do not. If you already hold an annuity and want to know whether your current rate is competitive, a second opinion on your annuity quote from an independent broker can identify whether better options exist before your surrender period ends.
Carrier Financial Strength and the Rate Trade-Off
One of the most important nuances in how to get the best annuity rates is understanding the relationship between rate and carrier financial strength. The highest advertised rates in any rate table are frequently offered by carriers with lower financial strength ratings from agencies such as AM Best. A carrier rated B++ or B+ by AM Best may offer a fixed annuity rate that is sixty to eighty basis points higher than a comparable product from a carrier rated A or A+. That spread represents real money over a multi-year term, and it creates a genuine trade-off that buyers must evaluate honestly rather than ignore.
Financial strength ratings evaluate an insurer’s long-term ability to honor its contractual obligations — which, for an annuity, may extend decades into the future. A guaranteed rate means nothing if the guarantor cannot perform. This is why most independent financial professionals recommend concentrating on carriers rated A- or higher by AM Best for annuity purchases, particularly for larger premium amounts or longer contract terms. The state guaranty association system provides a secondary layer of protection — all fifty states maintain insurance guaranty funds that protect policyholders up to statutory limits if a carrier becomes insolvent — but the limits vary by state and should not be treated as a substitute for selecting a financially strong carrier. For buyers whose premium falls within state guaranty limits, the financial strength trade-off becomes a nuanced calculation rather than an automatic disqualification. For buyers with larger premiums, concentrating on the A-rated tier of the market provides protection that the guaranty association limits cannot fully replicate. Our foundational guide to annuities covers carrier selection in the broader context of choosing the right product type and structure.
MYGA Rates: The Simplest Rate Comparison in the Market
Multi-Year Guaranteed Annuities represent the most transparent rate comparison available in the annuity marketplace. A MYGA contractually locks in a stated interest rate for a defined term — typically two through ten years — and that rate is the total return, compounded annually, that the buyer receives on their principal. There are no caps, participation rates, spreads, or index-linked variables to interpret. The rate stated is the rate earned, period. This simplicity makes MYGAs the appropriate starting point for any annuity rate comparison exercise, and also makes them among the most competitive products when shopping across carriers. Reviewing best MYGA annuity rates across the current market provides the clearest possible signal of where carrier rate competitiveness actually stands.
MYGA rates vary by term length in ways that mirror the broader bond yield curve. Shorter terms — two and three years — typically offer lower rates than longer terms, reflecting the lower opportunity cost to the carrier for a shorter commitment. The spread between a two-year and a seven-year MYGA rate can be meaningful, which is why term selection matters as much as carrier selection when optimizing for rate. Our term-specific pages for five-year annuity rates, seven-year annuity rates, and ten-year annuity rates allow direct comparison within each term bucket. Understanding how MYGAs compare to CDs in practice helps contextualize where annuity rates stand relative to the most familiar alternative safe-money vehicle. The tax-deferral advantage of annuities — credited interest accumulates without current tax — creates additional after-tax value beyond what the stated rate alone suggests, particularly for buyers in higher brackets.
Fixed Indexed Annuity Rates: What to Actually Compare
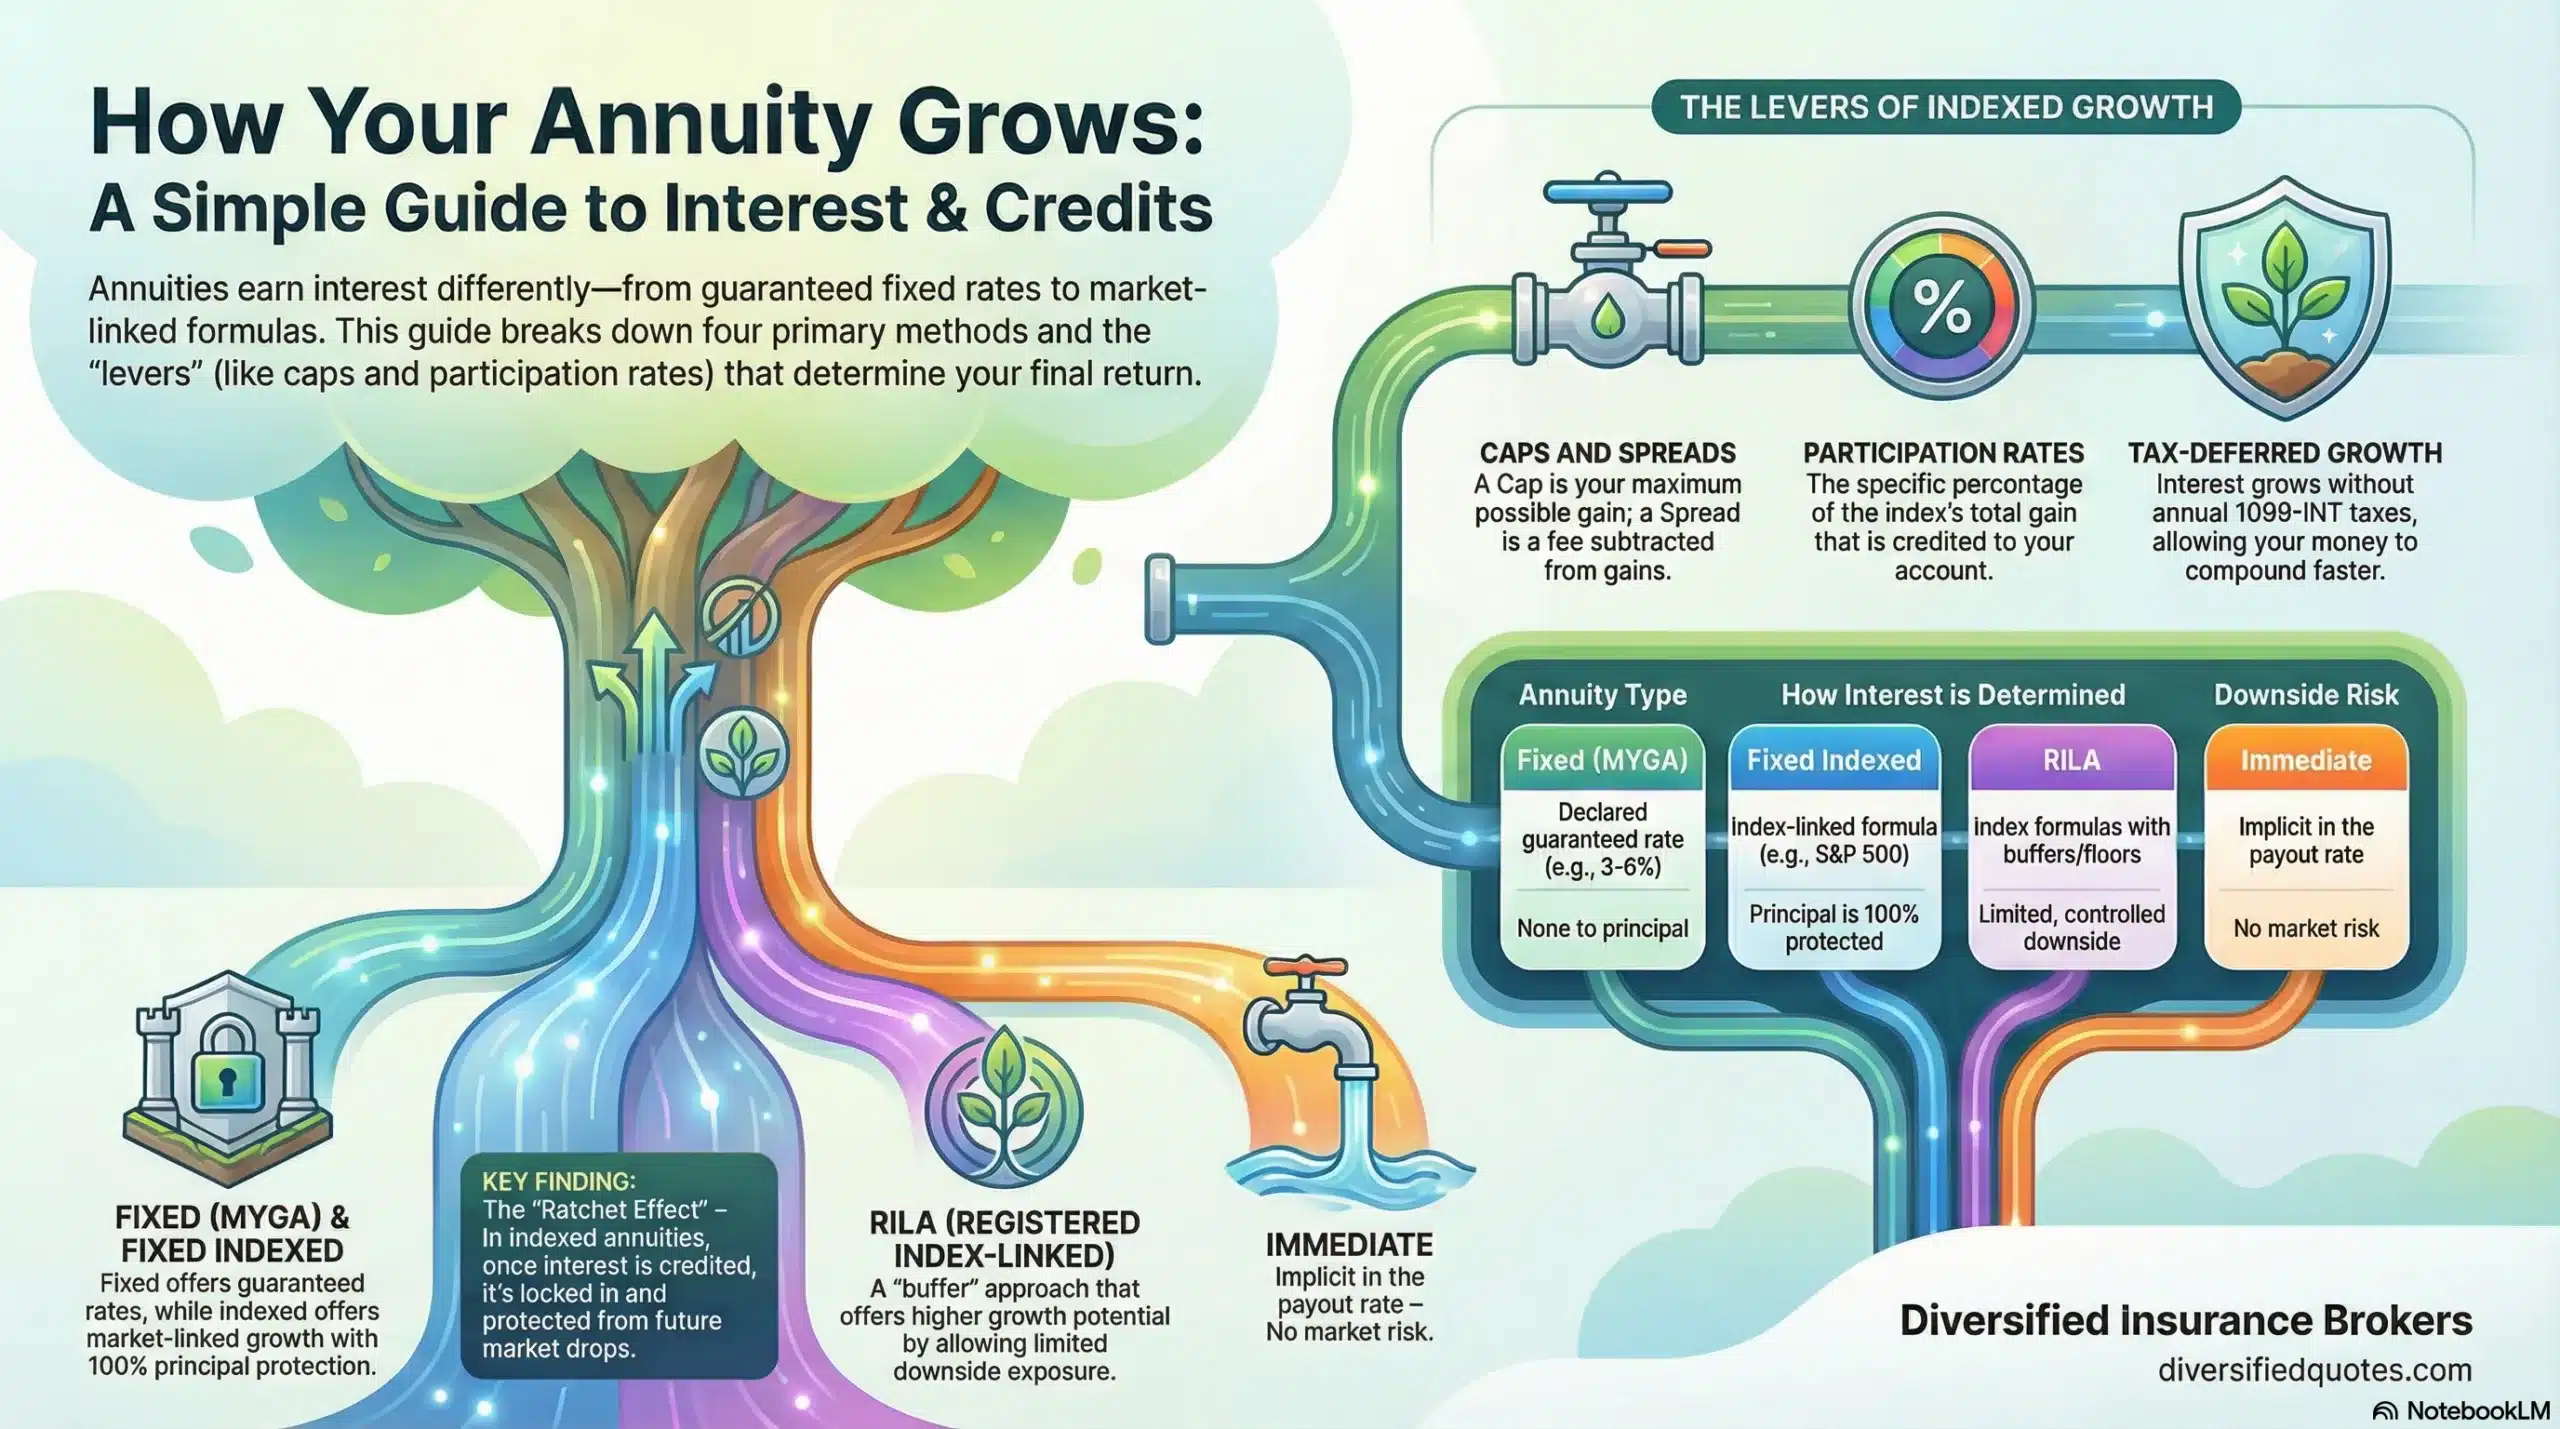
Fixed Indexed Annuities are structurally more complex than MYGAs, and comparing their rates requires understanding three distinct crediting mechanisms that insurers use. The most common is the cap rate — an annual ceiling on the interest that can be credited based on index performance. If an FIA has a twelve-percent annual cap on the S&P 500 and the index gains twenty-two percent in a given year, the buyer is credited twelve percent. If the index loses fifteen percent, the buyer is credited zero — the floor protection that defines the FIA structure. Understanding what an annuity cap rate means is therefore the starting point for any FIA rate comparison.
The second common crediting mechanism is the participation rate — instead of a cap, the insurer credits a fixed percentage of the index’s actual gain. A seventy-percent participation rate on an index that gains twenty percent produces fourteen percent credited interest. The third mechanism is the spread, sometimes called a margin or fee — the insurer subtracts a fixed percentage from the actual index gain and credits the remainder. A two-percent spread on a twenty-percent gain produces eighteen percent in credited interest. Understanding participation rates and spread rates alongside cap rates creates a complete picture of how different FIA products compare — and why a product with a lower cap but a higher participation rate may actually outperform over a multi-year period depending on index behavior. Crucially, cap rates and participation rates on FIAs are not always guaranteed for the life of the contract — they may be renewed annually at the carrier’s discretion, within contractually guaranteed minimum floors. Reviewing whether fixed indexed annuity rates change and under what conditions is essential before committing to a long-term FIA contract.
Income Rider Rates: The Comparison Beyond Accumulation
For buyers whose primary goal is guaranteed lifetime income rather than accumulation growth, the relevant rate comparison shifts from the crediting rate on the contract value to the terms of the income rider. A Guaranteed Lifetime Withdrawal Benefit (GLWB) rider operates on a separate income benefit base — a notional value that typically grows at a guaranteed roll-up rate, independent of the actual contract value performance. This roll-up rate, commonly ranging from four to eight percent annually on income benefit bases across the market, determines how large the income base becomes by the time the buyer activates withdrawals. Understanding what an annuity income roll-up rate is and how it compounds over a deferral period is critical to evaluating income rider offers across carriers.
Once income is activated, the payout rate — the percentage of the income benefit base paid annually — determines the actual dollar amount of guaranteed income. Payout rates vary by age at activation, with older buyers receiving higher percentages because the expected payment period is shorter. The combination of roll-up rate during deferral and payout rate at activation, minus any rider fees charged annually against the contract value, produces the net lifetime income per dollar invested. Comparing annuity income payout rates across carriers requires modeling specific scenarios — your current age, expected deferral period, and target activation age — because a carrier with a higher roll-up rate but a lower payout rate may produce inferior outcomes compared to one structured differently. For buyers evaluating fixed indexed annuities with income riders specifically, having all three variables — roll-up rate, payout rate, and rider fee — modeled together for your specific situation is the only way to make a valid comparison.
Timing: When Interest Rates Matter to Your Annuity Decision
Annuity rates move with the broader interest rate environment, which means the macroeconomic context at the time of purchase matters. The period from 2022 through 2024 produced the most favorable annuity rate environment in more than fifteen years as the Federal Reserve raised benchmark rates aggressively to address inflation. Fixed annuity rates that had been in the three-percent range for much of the prior decade moved into the five-to-seven percent range, representing a dramatic improvement in guaranteed return availability. Research from the period confirmed that current MYGA rates from A-rated carriers were near fifteen-year highs. For buyers evaluating whether annuities are a smart move when interest rates are elevated, the core principle is straightforward: locking in a multi-year guaranteed rate when rates are high preserves that yield even if rates subsequently decline.
The forward-looking question for buyers is therefore not simply what the current rate is, but where rates are likely to go relative to when they need income. Federal Reserve signals, Treasury yield curve positioning, and consensus economic forecasts all inform this view. A buyer who needs income in five to seven years and can lock in competitive rates today through a MYGA ladder or deferred FIA with an income rider may be better positioned than one who waits for potentially higher rates that may not materialize. Our resource on the fixed annuity ladder strategy covers how buying annuities across staggered terms captures multiple rate environments systematically rather than attempting to time the market with a single large purchase. The closely related concept of tax deferral strategies more broadly applies this logic across different product types and income activation dates.
Premium Amount and Its Effect on Rate Competitiveness
Carrier rate tables frequently include band pricing — different credited rates that apply at different premium thresholds. A carrier may offer a base rate of five-point-two percent for premiums under $100,000 and a higher rate of five-point-five percent for premiums of $100,000 or more. These premium bands vary by carrier and can represent a meaningful incentive to consolidate assets into a single annuity purchase rather than splitting across multiple smaller contracts. Before finalizing a premium amount, it is worth asking specifically whether the proposed amount falls within a rate band or just below the threshold for a higher tier, and whether consolidating additional assets would push you into a more favorable rate category.
Premium size also affects the carrier selection calculus in the context of state guaranty association limits. Most state guaranty associations protect annuity contract values up to $250,000 per owner per carrier, though limits vary by state and some states provide higher protections. Buyers with premiums above guaranty limits who want to stay within the protected coverage threshold may choose to split premium across two or more highly rated carriers rather than concentrating the full amount with one. This diversification strategy can sometimes be combined with rate optimization — buying different terms from different carriers allows you to capture the best available rate at each term length while also spreading carrier concentration risk. Understanding MYGA strategies for affluent buyers covers these higher-premium considerations in depth.
The Role of Surrender Periods and Liquidity in Rate Comparison
Annuity rates and surrender periods are directly linked. A carrier offering a higher rate for a seven-year MYGA is compensating you, in part, for your commitment to leave the premium in place for that term. If you access funds beyond the free withdrawal provision during the surrender period, you pay surrender charges that reduce the effective return. Understanding that higher rates typically come with longer surrender periods — and evaluating whether your liquidity situation is compatible with that commitment — is as important as the rate comparison itself. The highest advertised rate in the market attached to a ten-year surrender period that does not fit your income timeline is not actually the best rate for your situation. Highest guaranteed annuity rates and top annuity rates as of today should always be evaluated alongside the associated surrender terms, not in isolation.
Most fixed annuities include a free withdrawal provision — typically ten percent of the contract value per year — that allows limited liquidity without triggering surrender charges. This provision matters practically because it provides some access to funds without forfeiting the rate commitment. Reviewing the specific free withdrawal terms across competing contracts before purchase ensures you understand the liquidity reality of each option, not just the headline rate. Carriers also sometimes include waiver provisions that eliminate surrender charges in circumstances such as nursing home confinement, terminal illness, or unemployment, providing additional protection for situations where premature access becomes necessary. These provisions vary widely across carriers and add meaningful practical value beyond what the stated rate alone communicates.
Bonus Annuities: When the Headline Number Includes More Than Rate
Bonus annuities — fixed indexed annuities that credit an upfront premium bonus at contract issue — require a separate analytical lens when comparing to non-bonus products. The bonus immediately increases the starting value of the income benefit base or, in some cases, the contract value itself. A ten-percent premium bonus on a $200,000 deposit produces a $220,000 starting point before any crediting occurs. This can dramatically accelerate the income base growth during the deferral period, producing higher guaranteed lifetime income than a non-bonus product with the same premium. Reviewing bonus annuity comparisons requires examining the vesting schedule — the timeline over which the bonus becomes fully accessible — alongside the actual income or accumulation outcomes produced, because a large bonus subject to a long vesting schedule may underperform a smaller bonus with more favorable underlying rates over the same period.
The highest bonus fixed indexed annuity rates are particularly relevant for buyers doing IRA or 401(k) rollovers, where the bonus can immediately offset the perceived “cost” of moving assets and provide a meaningful head start on income base accumulation. For buyers in the annuity rescue situation — transferring from an underperforming existing annuity — an upfront bonus through a 1035 exchange or rollover can restore account values that surrendered product value had eroded. Evaluating bonus annuities requires comparing the complete picture across a realistic holding period of the full deferral and income phase, not just the day-one numbers, which is exactly the kind of multi-variable modeling that a carrier comparison across the full marketplace makes possible.
Talk With an Advisor Today
Choose how you’d like to connect—call or message us, then book a time that works for you.
Schedule here:
calendly.com/jason-dibcompanies/diversified-quotes
Licensed in all 50 states • Fiduciary, family-owned since 1980
Frequently Asked Questions: How to Get the Best Annuity Rates
Why do annuity rates vary so much between carriers?
Annuity rates differ across carriers because each insurer independently determines what it can credit to policyholders based on its own investment portfolio performance, expense structure, pricing strategy, and competitive positioning. Insurance companies invest annuity premiums primarily in bonds and fixed-income instruments, and the yield generated on those investments determines what the carrier can afford to credit. Two carriers investing in different bond durations, credit qualities, or asset classes will earn different net yields — and pass those differences through as different crediting rates on otherwise similar products. Additionally, carriers that distribute primarily through independent broker channels often carry lower distribution costs than companies with captive sales forces, and those savings sometimes appear as higher rates for buyers. Product design also plays a role: a carrier that has stripped a product of optional features may be able to offer a higher base rate than a carrier whose product includes more embedded flexibility. The practical takeaway is that the difference between the highest and lowest available rates on an otherwise identical MYGA term from the same time period can easily exceed half a percentage point, representing thousands of dollars in guaranteed interest over a multi-year term.
Should I choose the highest annuity rate regardless of carrier financial strength?
Not automatically. The highest advertised rate in any rate comparison is frequently offered by a carrier with a lower AM Best financial strength rating — often B++ or B+ rather than A- or higher. Lower-rated carriers must offer higher rates to attract premium deposits precisely because buyers perceive more risk. Whether that trade-off is appropriate depends on the size of your premium relative to state guaranty association limits, your risk tolerance, and the magnitude of the rate difference. For premiums within state guaranty limits — which protect annuity values up to at least $250,000 per owner per carrier in all states, with some states providing higher protection — the regulatory safety net means the practical financial risk difference between an A-rated and a B+-rated carrier is moderated. For premiums significantly above guaranty limits, concentrating assets with a lower-rated carrier creates exposure that the guaranty system cannot fully backstop. Most financial professionals recommend staying within the A-rated carrier tier for annuity purchases, particularly for larger amounts or longer terms where the insurer’s ability to perform matters over a longer horizon. The state guaranty association resource page explains the protection structure by state.
How do I compare fixed indexed annuity rates when they use caps, participation rates, and spreads?
Comparing fixed indexed annuities across different crediting mechanisms requires converting each structure to a common basis — typically projected credited interest under various index performance scenarios. A cap rate limits the upside gain credited in any given year. A participation rate credits a fixed percentage of the actual index gain. A spread subtracts a fixed margin from the actual index return and credits the remainder. Because these mechanisms produce different outcomes at different levels of index performance, there is no single number that makes one structure definitively better than another in the abstract. A high cap rate outperforms a high participation rate in years of modest index gains but may be surpassed by a high participation rate in exceptional years. The practical comparison requires modeling each option across a range of market scenarios — flat, moderate, and strong index performance — over the full intended holding period. Most professional presentations of FIA options include historical back-testing scenarios and realistic projection ranges rather than single-point assumptions. Working with an independent broker who can model multiple FIA structures simultaneously, using actual current cap rates and participation rates from competing carriers, produces a more useful comparison than reviewing brochures individually.
Does a longer annuity term always mean a better rate?
Generally yes, but the relationship is not always proportional and can be affected by the shape of the interest rate yield curve at the time of purchase. In a normal upward-sloping yield curve environment, longer-duration bonds earn higher yields, which allows carriers to offer higher crediting rates on longer annuity terms. A seven-year MYGA will typically offer a higher rate than a three-year MYGA from the same carrier. However, in periods when the yield curve is inverted — meaning short-term rates exceed long-term rates — the rate advantage of longer terms diminishes or can temporarily reverse. Beyond yield curve considerations, the practical question is always whether your timeline is compatible with the surrender period of the longer-term product. A higher rate on a ten-year annuity is not actually better if you need liquidity before the surrender period ends and face significant charges. The right term length is the longest one whose surrender commitment aligns with your genuine income timeline — and within that constraint, comparing rates across available terms identifies which carrier offers the most competitive pricing at your specific horizon.
Is now a good time to lock in an annuity rate?
The period following the Federal Reserve’s rate increases from 2022 through 2024 produced the most favorable annuity rate environment in more than fifteen years. Fixed annuity rates that had been in the two-to-three percent range for much of the prior decade moved into the five-to-seven percent range for multi-year guaranteed annuities. As of April 2026, rates from A-rated carriers remain near fifteen-year highs, though modest declines are expected as the Fed eases monetary policy. Whether this represents the ideal moment to lock in depends on your personal income timeline, not on trying to predict the exact rate peak. For buyers who need guaranteed income or guaranteed growth within a five-to-ten year window, locking in rates at current levels provides certainty that waiting does not. If rates decline over the next several years — which the consensus view suggests is more likely than a significant further increase — those who locked in earlier will have captured returns unavailable to those who waited. The annuity ladder strategy allows buyers to capture current rates on a portion of assets while keeping other portions available to benefit from future rate changes.
How does a premium bonus affect the effective annuity rate?
A premium bonus increases the starting value upon which interest is credited, which can significantly enhance the effective long-term rate relative to the stated crediting rate alone. A ten-percent upfront bonus on a $200,000 premium means interest compounds on $220,000 from day one rather than $200,000, producing a larger accumulated value or income base over the holding period even if the stated crediting rate is lower than a competing non-bonus product. However, the bonus comparison requires careful analysis of the vesting schedule — the timeline over which the bonus becomes fully accessible without penalty — and the underlying cap rates or crediting terms that accompany the bonus. Some bonus products offset the bonus by providing lower cap rates or participation rates than equivalent non-bonus products, partially or fully neutralizing the advantage over multi-year holding periods. The honest comparison requires running the complete projection across the full intended holding period with all bonus, crediting, and vesting terms incorporated rather than simply comparing the bonus percentage to a non-bonus rate side by side.
Can I lose money in an annuity if rates seem high now but conditions change?
For fixed annuities and fixed indexed annuities — the types discussed throughout this guide — the answer depends on what you mean by lose money. Your principal and all credited interest are protected from market losses in fixed and fixed indexed annuities. You cannot lose money due to stock market downturns or falling interest rates after purchase, because the rate is either guaranteed for the term or floored at zero in any index-linked year. Where actual dollar loss can occur is through early surrender charges if you access funds before the surrender period ends. If a carrier charges an eight-percent surrender fee in year one and you withdraw funds in year one, the surrender charge reduces your effective proceeds. Free withdrawal provisions — typically allowing ten percent of contract value per year without penalty — provide a liquidity safety valve without triggering charges. Understanding the complete surrender schedule before purchase, and ensuring your intended holding period comfortably exceeds the surrender period, eliminates the practical risk of loss from early surrender.
What is the difference between accumulation rate and income rate in an annuity?
In a deferred annuity with an income rider, two separate rates operate simultaneously on two separate values. The accumulation rate — whether a fixed MYGA rate, FIA cap rate, or participation rate — governs how the actual contract value grows over time. The contract value is the real, accessible money that can be surrendered, withdrawn, or passed to beneficiaries. The income roll-up rate governs how a separate income benefit base — a notional accounting value used only to calculate future income payments — grows during the deferral period. These two values can diverge significantly over time: the contract value may grow at a moderate rate tied to actual index performance, while the income benefit base grows at a guaranteed roll-up rate regardless of market conditions. When income is activated, the guaranteed lifetime income payment is calculated as a percentage of the income benefit base, not the contract value. Buyers focused on maximizing lifetime income should pay close attention to roll-up rates and payout percentages on the income benefit base, not just the accumulation crediting rate, because those terms determine actual income outcomes.
About the Author:
Jason Stolz, CLTC, CRPC, DIA, CAA and Chief Underwriter at Diversified Insurance Brokers (NPN 20471358), is a senior insurance and retirement professional with more than 25 years of real-world experience helping individuals, families, and business owners protect their income, assets, and long-term financial stability. As a long-time partner of the nationally licensed independent agency Diversified Insurance Brokers, Jason provides trusted guidance across multiple specialties—including fixed and indexed annuities, long-term care planning, personal and business disability insurance, life insurance solutions, Group Health, Travel Medical and Evacuation Insurance, and short-term health coverage. Diversified Insurance Brokers maintains active contracts with over 100 highly rated insurance carriers, ensuring clients have access to a broad and competitive marketplace.
His practical, education-first approach has earned recognition in publications such as VoyageATL, and contributions from his agency featured in Kiplinger and GoBankingRates— highlighting his commitment to financial clarity and client-focused planning. Drawing on deep product knowledge and years of hands-on field experience, Jason helps clients evaluate carriers, compare strategies, and build retirement and protection plans that are both secure and cost-efficient. Visitors who want to explore current annuity rates and compare options across multiple insurers can also use this annuity quote and comparison tool.
Explore More Annuity Options: Browse our complete guide to Annuities 101 — covering annuity education, planning guides, pros & cons, how to choose & buy from 100+ carriers.
Last Reviewed: September 3, 2026 |
Reviewed by: Jason Stolz, CLTC, CRPC, DIA, CAA
Chief Underwriter, Diversified Insurance Brokers, Inc. | NPN: 20471358 | Diversified Insurance Brokers, Inc. — Licensed in all 50 states
Fact Checked by: Tonia Pettitt, CMIP©
Medicare Specialist, Diversified Insurance Brokers, Inc. | NPN: 14374308 | Diversified Insurance Brokers, Inc. — Licensed in all 50 states
Did you find this content helpful? Leave us a Google review — it helps others find trustworthy guidance too.
Editorial Standards: Diversified Insurance Brokers maintains rigorous editorial standards to ensure accuracy, clarity, and independence in all content. Learn more about our editorial standards and commitment to transparency.
